
Printed electrode thickness control needs paired resistance measurements because deposited volume and electrical continuity can change independently. Measure cured thickness, sheet resistance, and actual trace resistance at matched locations; assess electroactive area separately. For a demanding inspection plan, use expanded measurement uncertainty no greater than 10% of each full tolerance band as a reference target. This is a metrology target, not an electrode performance or patient-safety limit.
Separate the Four Quantities Before Setting Limits
Film thickness, sheet resistance, trace resistance, and electroactive area describe different properties of a printed electrode. A result for one cannot release the others.
| Quantity | What the result describes | Useful measurement | What it cannot establish |
|---|---|---|---|
| Cured film thickness, t, in µm | Local deposited layer height above its underlying surface | Step-height profile or prepared cross-section | Conductive particle connectivity or interfacial chemistry |
| Sheet resistance, R_s, in Ω/□ | In-plane resistance normalized to the geometry of a uniform film | Corrected four-point probe measurement or defined rectangular coupon | Resistance of every narrow trace or connector |
| Trace resistance, R_trace, in Ω | Electrical path between specified endpoints | Four-wire Kelvin measurement on the actual path | Electrode-skin impedance or electrochemical activity |
| Electroactive area, A_e, in cm² | Method-dependent area participating in a selected electrochemical process | Qualified cyclic voltammetry or chronocoulometry | Physical film thickness or all intended-use performance |
The geometric exposed area is a separate drawing dimension. An insulation opening can reduce that area without changing the underlying print thickness. Surface chemistry can change A_e while the opening remains identical.
Specify which layer is being measured. A carbon layer printed over silver has a carbon thickness, a silver thickness, and a total stack height. Measuring resistance across the connected stack may predominantly characterize the silver path. It does not isolate the carbon layer.
Thickness and resistance are continuous variables. They do not have a universal set of medical-electrode grades or mandatory increments. Print-pass count is an integer process setting, but no finite industry-wide pass-count menu applies to every ink and substrate. Specify the qualified count for the actual construction.
Why Thickness Alone Cannot Predict Resistance
Thickness predicts resistance only when material state, geometry, and current path remain comparable. Screen printed trace thickness variation can explain a change. It cannot diagnose every failure.
For a uniform, isotropic, single conducting layer:
R_s = ρ_eff / t
R_trace = R_s × L / W
Here, ρ_eff is effective in-plane resistivity in Ω·m; t is thickness in m; and L and W are the length and width of a uniform rectangular current path in matching units. The ratio L/W is the number of squares. The trace equation assumes approximately uniform current flow and excludes additional connection resistance.
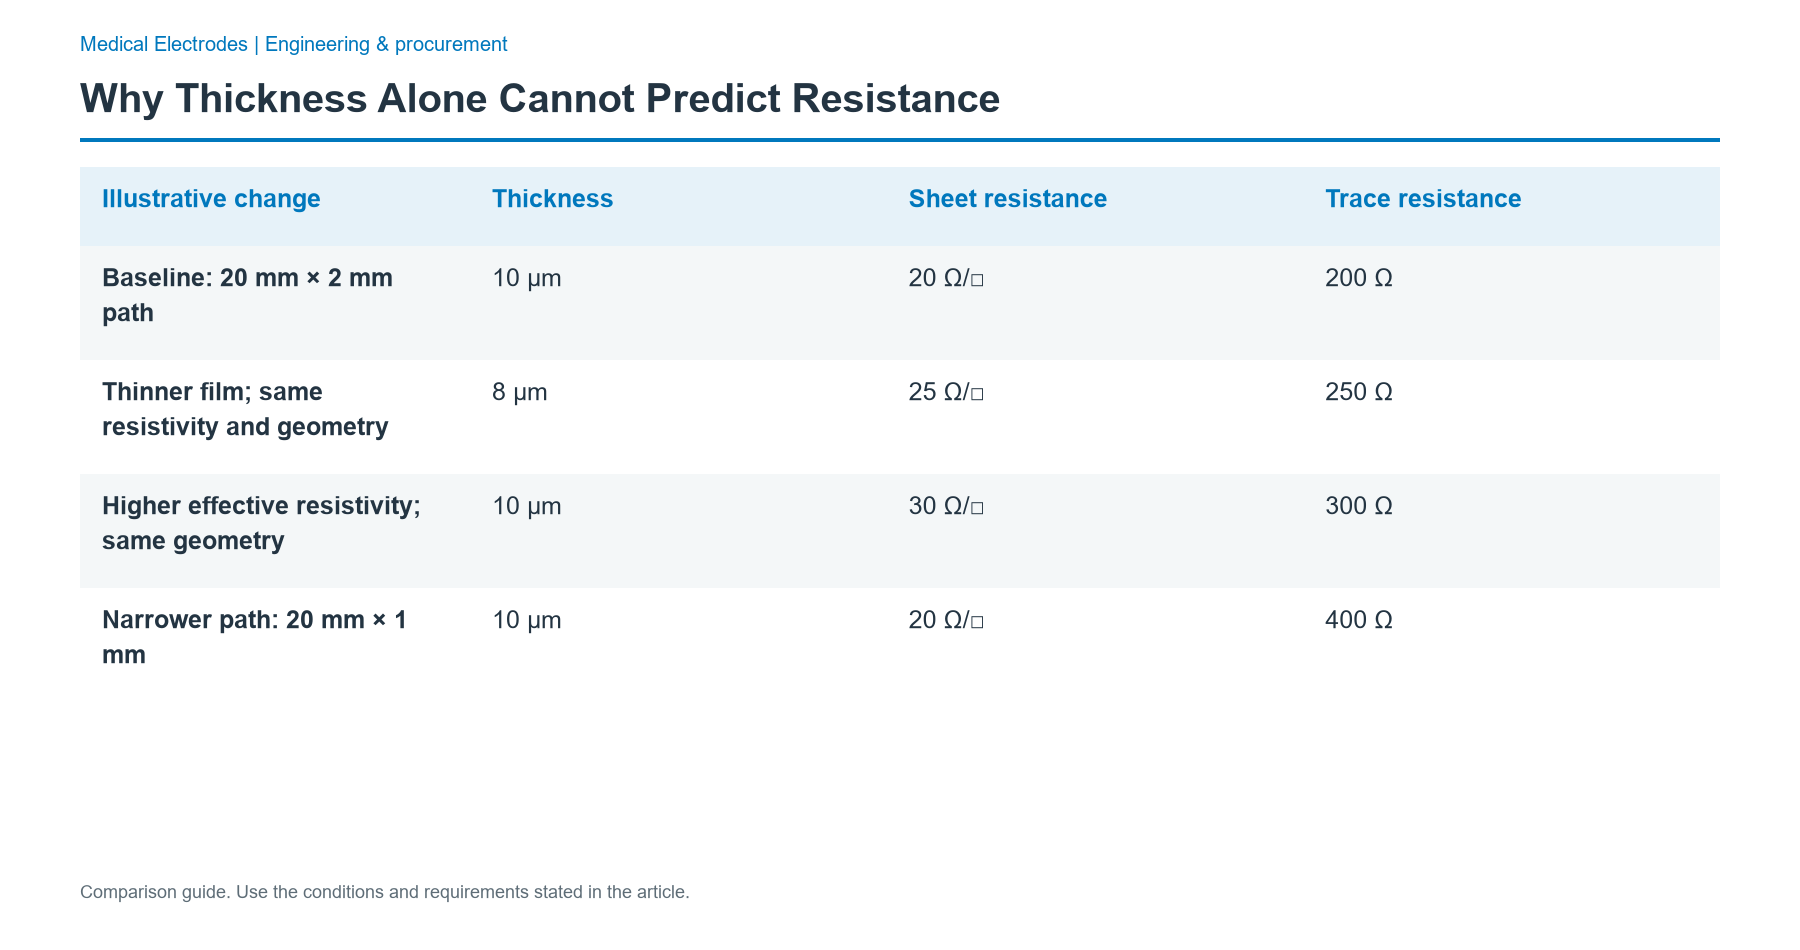
Consider an illustrative calculation, not a material specification or measured batch. A 10 µm film with R_s = 20 Ω/□ has ρ_eff = 0.0002 Ω·m. A straight path 20 mm long and 2 mm wide contains 10 squares, giving R_trace = 200 Ω.
| Illustrative change | Thickness | Sheet resistance | Trace resistance |
|---|---|---|---|
| Baseline: 20 mm × 2 mm path | 10 µm | 20 Ω/□ | 200 Ω |
| Thinner film; same resistivity and geometry | 8 µm | 25 Ω/□ | 250 Ω |
| Higher effective resistivity; same geometry | 10 µm | 30 Ω/□ | 300 Ω |
| Narrower path: 20 mm × 1 mm | 10 µm | 20 Ω/□ | 400 Ω |
Reducing thickness from 10 µm to 8 µm increases resistance by 25% under the stated assumptions. It does not increase resistance by 20%. A width change produces a different failure: the coupon's sheet resistance can stay on target while the actual trace resistance doubles.
Printed carbon is a particle-and-binder network. Drying, cure, dispersion, porosity, and local discontinuities can alter the connected conductive network, so identical thickness does not guarantee identical ρ_eff. A thicker but poorly connected film may conduct worse than a thinner, well-formed film.
Calculate R_s × t for each matched location before averaging. Keep the pairs together. Multiplying a lot-average thickness by an unrelated average R_s loses the relationship between deposit and conductivity, particularly when a thin region also has poor particle connectivity. Compare like specimens: the layer, ink, cure state, and measurement geometry must match. Investigate shifts against the established method variation; a single apparent resistivity cannot identify the cause of a crack, texture effect, or multilayer bypass.
Build a Paired Thickness and Resistance Measurement
A useful paired measurement links the same material lot, printed position, process stage, and conditioning state. Two unrelated averages cannot show whether a thin region is also electrically abnormal.
Define the specimen and test stage
Identify the specimen first. Before comparing results, release the ink identity, substrate, layer order, artwork revision, print-pass count, and cure record, and map each coupon identifier to its panel or web position and the actual electrode feature it represents.
Name the test stage. Measure after conductor cure, after subsequent layer processing, and after conversion when those operations can affect the path. Keep qualification specimens for bending, aging, or environmental exposure separate from unstressed specimens. An after-cure result and an after-lamination result answer different questions.
For multilayer prints, include a witness feature that isolates each critical conductive layer. Establish its correlation with the product geometry. A wide coupon printed beside a narrow neck is not automatically a valid substitute for that neck.
Measure a defined dry-film step
Start with a real step. Measure cured film height relative to the actual underlying surface with a qualified stylus or optical profilometer. The method must define the scan direction, reference region, filtering, averaging region, probe settings, and treatment of edge ridges so that a second operator can reconstruct what the reported thickness represents. Keep the profile.
A soft film can deform under a stylus. A rough or optically difficult surface can invalidate an optical height reconstruction. Compare the chosen method with a prepared cross-section when step definition or layer identity is uncertain, recognizing that cutting and preparation can also distort the specimen.
Do not use total laminate caliper to infer a thin conductive deposit. Substrate thickness, adhesive compression, surface texture, and underlying layers contribute to the same reading. Wet-film height and cured-film height also require separate labels; solvent loss prevents a simple one-to-one substitution.
Choose the electrical geometry deliberately
Use separate electrical methods for coupon sheet resistance and product trace resistance. The practical alternatives are two-wire resistance, four-wire Kelvin resistance, four-point collinear probing, and van der Pauw measurement; they are named methods, not interchangeable accuracy grades.
| Method | Suitable use | Boundary to control |
|---|---|---|
| Two-wire resistance | Continuity screening or a path whose fixture contribution is acceptably small | Leads and contact resistance are included; demonstrate their contribution |
| Four-wire Kelvin resistance | Actual trace between defined sense points | Separate force and sense contacts; sense placement defines what is included |
| Four-point collinear probing | Sheet-resistance coupon with known boundary geometry | Probe spacing, film thickness, edge distance, correction factor, and probe damage |
| van der Pauw measurement | Homogeneous, uniform-thickness, simply connected coupon | Small perimeter contacts, contact order, anisotropy, and specimen assumptions |
Four wires do not automatically turn a trace measurement into sheet resistance. A Kelvin fixture measures the resistance between its sense connections. A collinear probe infers sheet resistance from a different current distribution and an applicable geometric correction.
For equally spaced collinear probes on a sufficiently thin sheet, the usual form is R_s = 4.532 × (ΔV / i_test) × C_g, where C_g is the applicable dimensionless geometry correction. The outer probes carry current; the inner probes sense voltage. Use the correction for the actual coupon boundary and probe spacing. Applying the large-sheet factor alone to a narrow product trace can produce a plausible but wrong value.
Use an electrically insulating support without a parallel conductive layer for isolated-film coupons. Keep test current low enough to avoid self-heating or changing the specimen, and establish an ohmic region during method qualification. Record actual current, voltage compliance, settling time, contact force, and sample temperature. A stable display is not sufficient evidence of a valid contact.
Preserve position and repeatability
For initial process mapping, a practical layout has five named locations: leading-left, leading-right, center, trailing-left, and trailing-right, referenced to the print direction. This is a proposed diagnostic map, not a lot-acceptance sampling standard. Add actual narrow traces, overlaps, and connector transitions that these locations cannot represent.
At each location, pair a thickness result with a nearby, non-damaging electrical measurement. If probing marks the surface, allocate adjacent matched features and keep the sequence fixed. Separate variation within a printed sheet from variation across sheets, runs, and material lots.
Repeat selected readings without moving the specimen, then lift and reseat it. Compare the spreads. A change after reseating points toward fixture registration or contact sensitivity, while a persistent difference between mapped locations warrants a print investigation once the fixture contribution is understood. During method qualification, compare operators or fixtures using the same identified specimens. Retain each reading with its position and test sequence so a lot average cannot hide a weak neck.
Diagnose the Combined Pattern Before Adjusting the Press
The relationship between thickness and resistance determines the next investigation. First repeat the fixture and reference checks; then follow the pattern below without changing several process variables at once.
| Observed pattern | First branch to investigate | Next useful evidence |
|---|---|---|
| Thickness low; R_s high | Reduced deposition or local missing coverage | Step profiles, print image, screen condition, ink handling, matched positions |
| Thickness on target; R_s high | Conductive network, contamination, cure, or electrical method | Isolated-layer coupon, contact repeatability, cure history, material identity |
| Thickness high; R_s high | Poor network formation, incomplete processing, voids, or wrong layer measurement | Cross-section, surface profile, qualified cure comparison; avoid assuming more ink is the cure |
| R_s on target; R_trace high | Narrowing, long path, crack, overlap, or included connection | Actual width map, sense-point drawing, microscopy, localized path measurements |
| Bare print passes; converted part fails | Lamination, die cutting, bending, connector, or handling damage | Before/after measurements on traceable matched specimens |
| Thickness and dry resistance pass; sensor response shifts | Exposed area, surface chemistry, reagent, electrolyte, or reference behavior | Opening dimensions and the specified electrochemical system test |
Treat each branch as a hypothesis. A probe mark can mimic a material defect; a hidden conductive underlayer can mask one. Preserve affected samples before retesting, and identify the first operation after which the paired result changes. Keep the lot on hold when an agreed release characteristic fails, then test the proposed correction on traceable comparison specimens before changing production settings.
Electrode sheet resistance control should track both the distribution and its spatial pattern. A gradual shift across the web differs from random outliers or a sudden material-lot step. Link the measurements to production records so the proposed correction addresses an observed mechanism.
Set Acceptance Rules That the Measurement Can Resolve
Printed electrode thickness control needs separate drawing limits for thickness and electrical behavior, plus a stated uncertainty and decision rule. A process-control limit is not automatically a product acceptance limit.
Use expanded uncertainty U ≤ 10% of the full tolerance width as a demanding measurement-development target. Record the coverage factor and uncertainty budget. This article's reference target is a selected engineering objective, not a medical-electrode standard or a claim about JASPER equipment.
For an illustrative thickness requirement of 10 ± 1 µm, the full allowed width is 2 µm, so the target is U ≤ 0.2 µm. For an illustrative R_s requirement of 20 ± 2 Ω/□, the full width is 4 Ω/□ and the corresponding target is U ≤ 0.4 Ω/□. These examples define measurement capability; they do not recommend those film or resistance values for every electrode.
A conservative agreed rule can require the entire uncertainty interval to lie inside the specification: measured value − U ≥ lower limit, and measured value + U ≤ upper limit. Under that rule, 10.9 µm with U = 0.2 µm does not establish conformity to the 9–11 µm band, because the interval reaches 11.1 µm. Place that result on hold for disposition; do not silently round it into acceptance.
Display resolution is only one input. Include calibration, repeatability, specimen repositioning, contact behavior, geometry, surface definition, and conditioning where relevant in the uncertainty evaluation. If the method cannot resolve the tolerance, improve the fixture or method first; changing the product limit requires a separate design decision supported by the OEM's functional requirements.
Use a paired inspection record
The following record structure connects each result to its method and release decision. Use one record per mapped feature and process stage, with linked raw data rather than a single unlabeled lot average.
| Record group | Fields to capture | Required output |
|---|---|---|
| Identity | Part/revision, lot, ink/substrate lots, feature ID, mapped position, sample count | Traceable specimen and layer |
| Process state | Print count, cure record, elapsed conditioning time, conversion state | Comparable test stage |
| Thickness | Method revision, scan location/settings, t in µm, individual profiles, U in µm | Result against thickness limits |
| Coupon electrical | Geometry/correction, R_s in Ω/□, test current, temperature, U in Ω/□ | Result against sheet-resistance limits |
| Product electrical | Sense endpoints, R_trace in Ω, fixture, current, U in Ω | Result against path-specific limits |
| Area/interface | Opening area in mm²; A_e in cm² if required; electrolyte and method revision | Separate dimensional/electrochemical decision |
| Disposition | Specification revision, decision rule, result, reviewer, containment/action reference | Accept, hold, or reject with a reason |
Agree the sampling plan, failure response, and retest rules before the lot is made. The five-location map helps diagnose a process; it does not establish a statistical acceptance sample size or prove capability across future lots.
Keep Electroactive Area and Device Validation Separate
Electroactive area requires an interfacial test. Film thickness and dry DC resistance cannot supply it. Normalize an electrochemical result only with an area definition that matches the question.
For a biosensor comparison, hold the electrolyte, redox probe, concentration, temperature, reference arrangement, conditioning, and measurement protocol constant, because changing these inputs can change the apparent area without changing the printed outline. Select the model deliberately. A cyclic-voltammetry area estimate depends on transport and kinetics; chronocoulometry has its own adsorption and background-charge considerations. Neither produces a universal material constant.
Report geometric area and electroactive area separately. If current is divided by geometric area, label the result accordingly; do not rename it electroactive-area-normalized current. A change in insulation opening, reagent coverage, or wetting can alter response without a failed dry conductor.
For recording electrodes, a dry trace check does not establish electrode-skin impedance, noise, or motion performance. For stimulation electrodes, it does not establish current distribution, thermal behavior, or a permitted treatment setting. An Ag/AgCl reference structure also depends on its electrolyte and interface condition, beyond continuity of its printed conductor.
The OEM's finished-device program owns the intended-use evidence. The printed-component inspection plan supplies controlled inputs and traceable results to that program.
Turn the Results into a Supplier Handoff
A useful supplier handoff specifies what is supplied, what is measured, and who releases each requirement. Keep bare printed electrodes, converted components, downstream reagent or hydrogel layers, and the complete device as distinct deliverables.
JASPER's carbon printed electrodes and sensor arrays provide the product route for a drawing-based discussion of carbon geometry, conductive routing, insulation, conversion, and inspection scope. The purchase specification should identify whether electrochemical testing is included, performed by another specialist, or owned by the OEM; printed-component supply does not imply a complete biosensor service.
Connect each sample record to its drawing revision, mapped feature, test stage, thickness profile, R_s result, and R_trace sense points. Keep the raw readings. The change-notification agreement should name ink substitution, substrate treatment, screen replacement, print count, cure, and conversion, and assign who decides whether each change needs a new coupon-to-product comparison before routine acceptance resumes. An unchanged nominal drawing does not establish that the previous correlation still applies. Record the comparison and release decision together.
The broader screen-printed medical electrode manufacturing process explains the upstream layer sequence. The release decision here rests on the paired measurements and the separately assigned interface tests.
Frequently Asked Questions
Why measure resistance if the printed thickness is within tolerance?
Thickness does not reveal the quality of the conductive network or the actual current path. Two prints can have the same height but different particle connectivity, cracks, or cure state. Pair thickness with sheet resistance on a suitable coupon and trace resistance between specified product endpoints, then investigate disagreements before releasing the lot.
Are sheet resistance and trace resistance interchangeable?
No. Sheet resistance is expressed in Ω/□, while trace resistance is the resistance in Ω between named endpoints. For a uniform rectangular film, trace resistance equals sheet resistance multiplied by length divided by width. Necking, bends, overlaps, parallel layers, and included connections can make that simple conversion unsuitable for the actual part.
Can four-wire resistance replace a four-point sheet-resistance test?
Only when the specimen geometry and conversion method justify it. A Kelvin measurement on a defined rectangular coupon can support a sheet-resistance calculation. An arbitrary product trace cannot use the same conversion automatically. Collinear four-point probing requires its own geometric corrections, and the force and sense connections must match the selected method.
What thickness uncertainty should the inspection method target?
Use expanded uncertainty no greater than 10% of the full thickness tolerance width as a demanding reference target. For an illustrative 10 ± 1 µm requirement, that means U ≤ 0.2 µm. Record the coverage factor and evaluate the complete measurement method; the instrument's displayed resolution is not an uncertainty statement.
Does a thicker carbon print always lower resistance?
No. Greater thickness lowers sheet resistance only when effective resistivity and the relevant current distribution remain comparable. Changes in drying, cure, porosity, dispersion, or cracking can outweigh the thickness increase. Compare paired measurements from the same construction and process stage instead of adding print passes solely to correct a high resistance reading.
Can dry resistance confirm electroactive area or medical performance?
No. Dry resistance characterizes an electrical path, while electroactive area comes from a defined interfacial measurement. Reagent coverage, electrolyte, surface chemistry, and the insulation opening can alter sensor response independently. Recording and stimulation devices also require their own system validation; a passing printed-circuit inspection does not establish a clinical or safety claim.
Send the Drawing with a Paired Test Plan
Send Drawing with the circuit and electrode layout, substrate, contact area, tail or connector, insulation and conversion layers, packaging, quantity, and validation responsibilities. Include thickness and resistance limits, measurement locations, specimen stage, and the acceptance decision rule so the quotation can separate component manufacture, inspection records, and OEM validation work.
Bring the drawing, stack and operating conditions
JASPER engineering will review the interfaces, open risks and evidence required for a production quote.