
Capacitive touch controller tuning should begin with channel data from the finished electrical and mechanical stack—not with a lower threshold. This guide gives OEM electrical, firmware, HMI, and quality teams a controlled plan for separating weak touch signal, touch sensor noise, grounding faults, display coupling, water effects, and enclosure changes. It does not replace controller-vendor firmware engineering or product-level EMC qualification. It decides what to measure, which variable to change first, and what evidence should pass from the touch-interface supplier to the OEM team.
1. Why tuning starts with a controlled hardware state
A tuning file is valid only for the build that produced its data. Electrode geometry, cover thickness, adhesive continuity, air gaps, flex routing, connector pinout, display position, enclosure ground, power source, and controller firmware all influence the measured channel. Tune touch sensing in the complete final mechanical and electrical environment, and remove attached debuggers or laptops when their ground path is not part of the released equipment.
That rule changes the first question. Do not ask, “Which sensitivity value should be used?” Ask, “Is this the hardware, power state, and mechanical stack that will be validated?” A capacitive touch switch tuned as an exposed PCB may lose margin after a thicker lens, display, adhesive void, metal bezel, or grounded enclosure is added. The reverse also occurs: a threshold raised to calm an open-bench prototype can create missed touches after the final assembly improves the signal path.
Controller tuning is not the best first action when one revision has a different electrode, an unbonded overlay, a damaged shield, an intermittent connector, supply ripple outside the design target, or a display cable crossing a sense trace. Firmware can filter a bounded disturbance. It cannot restore touch signal lost to a stack-up error, nor should debounce hide a repeatable hardware spike that crosses the detection threshold.
A controlled build needs a short identity record: assembly revision, controller and library version, tuning-file checksum, overlay and adhesive revision, display model and mode, enclosure state, supply, cable set, and debugger connection. Without that record, “before” and “after” traces may describe two different systems.
2. Read channel data before changing sensitivity
Touch data should show the sensor’s measured value, its reference, the difference between them, and the resulting state. Vendor names differ. Infineon CAPSENSE uses RawCount, Baseline, and DiffCount; STMicroelectronics STMTouch commonly exposes measure, reference, and delta. The concepts can be mapped for diagnosis, but register names and algorithms must remain tied to the selected controller library.
| Quantity | Engineering meaning | What to record | What a suspicious trace suggests |
|---|---|---|---|
| Raw count / measure | Digitized capacitance-related channel reading | Timestamped value for every scan and channel | Ripple, bursts, clipping, cross-channel movement, or state-dependent offset |
| Baseline / reference | Filtered no-touch estimate that follows allowed slow change | Value beside raw count, including reset or freeze events when available | Baseline chases a held touch, cannot follow drift, or resets after a disturbance |
| Delta / difference count | Touch-related separation, commonly raw count minus baseline | Untouched distribution and deliberate-touch distribution | Too little separation, wrong polarity, adjacent-channel coupling, or stack variation |
| Peak-to-peak noise | Maximum minus minimum no-touch reading within a defined state and window | Minimum, maximum, window length, scan rate, and state | Averages can look stable while threshold-crossing peaks remain hidden |
| Signal | Difference between representative touched and untouched readings | Touch method, contact area, position, force policy, and repeated trials | High center signal but weak edge/corner response; glove result differs from bare finger |
| SNR | Touch signal divided by peak-to-peak no-touch noise under the same defined condition | Per channel and operating state, with the formula retained | A single “SNR” number without state or method cannot support release |
| Detection threshold | Delta required to declare touch, subject to the controller algorithm | Per-channel ON setting and units | Too low creates false events; too high creates missed or edge-sensitive touches |
| Hysteresis / release threshold | Separation between ON and OFF decisions | ON and OFF values plus release trace | Chatter near threshold or a control that remains latched |
| Debounce / confirmation scans | Consecutive qualifying scans before state changes | Scan count and measured latency | One-scan spikes pass, or excessive delay makes the HMI feel unresponsive |
| Scan rate / acquisition settings | Timing and analog configuration behind each sample | Actual rate in every power mode | A setting change alters noise bands, latency, or baseline behavior |
Measure noise as peak-to-peak no-touch raw-count variation. For the documented CAPSENSE method, use 5:1 SNR and approximately 500 samples as the first characterization screen. The selected controller, electrode/lens stack, scan configuration, operating states, and product risk define the released method and margin.
The measurement method matters as much as the ratio. Capture the same state for the untouched and touched distributions. If a 500-sample no-touch window is taken with the display static and the touch sample is taken while the backlight PWM changes, the quotient mixes two conditions. Preserve the raw series; do not report only an average. A periodic spike can disappear in a mean while still crossing the threshold every twentieth scan.
For Infineon systems, the ModusToolbox CAPSENSE Tuner can graph RawCount, Baseline, DiffCount, status, and position. TI’s CapTIvate Design Center and Microchip’s MPLAB Data Visualizer provide comparable real-time inspection for compatible devices. Use the controller vendor’s tool where possible, export the data, and attach configuration and firmware versions to the log.
Controller-scoped parameter example: Finger threshold at 80% of measured touch signal, noise threshold at 40%, hysteresis at 10%, three ON-debounce scans, and 30 low-baseline-reset scans belong to the documented Infineon method. Do not transfer these values to another controller or electrode stack without measurement.
3. A ten-point tuning and noise-debug framework
The framework below puts evidence before parameter changes. Each criterion has a acceptance evidence that supports the next step and a release blocker that sends the investigation back toward hardware, test control, or missing data.
3.1 Freeze the representative build
Start with the controller PCB, sensor, overlay or cover lens, adhesive, flex, connector, display, enclosure, power supply, and firmware intended for the test phase. Photograph the assembly and record revisions. If production adhesives or coatings are unavailable, identify the substitute and its thickness rather than calling the build final.
Two nominally identical assemblies show comparable no-touch and touch distributions in the same operating state.
Tuning takes place on a loose sensor while the failure occurs only after bonding, display installation, bezel fastening, or earth connection.
3.2 Capture a complete per-channel dataset
Binary touch events are insufficient. Stream raw count/measure, baseline/reference, delta, state, timestamp, and channel identifier. Add display mode, backlight duty, supply source, communications load, enclosure state, and debugger connection as test metadata. Infineon, Microchip, TI, and ST tools expose enough channel-level information to support this step on their respective platforms.
A reviewer can reconstruct which physical and electrical state produced every trace.
The only evidence is “button 4 triggers itself” or a screenshot with no time scale, controller settings, or build revision.
3.3 Measure distributions, not one ideal touch
Characterize the center, edge, and expected approach for every electrode. Record repeated bare-finger touches using a defined method, then handle gloves as a separate requirement. Compare untouched peak-to-peak noise with the smallest valid touch signal in each relevant state. The initial ≥5:1 screen may identify weak channels, but the approved project criterion should govern release.
The weakest intended touch remains separated from the worst observed no-touch excursion with documented margin.
A strong center touch is used to approve a channel that misses at the icon edge, through the final lens, or in a low-power scan mode.
3.4 Classify the disturbance before treating it
A slow raw-count movement points toward temperature, humidity, contamination, mechanics, or baseline tracking. A line-frequency or PWM-synchronous ripple points toward supply, display, lighting, or common-mode coupling. Isolated bursts may follow a radio, motor, relay, charger, communication edge, ESD event, or electrical fast transient. Noise that increases only when a person touches the product suggests an earth-referenced common-mode path, a mechanism described in TI’s CapTIvate guidance.
The trace has a named pattern and a repeatable trigger.
Every failure is labeled “too sensitive,” followed by a higher threshold.
3.5 Toggle one aggressor at a time
Use controlled A/B tests. Compare battery with the intended AC supply; display off with display on; static image with high-transition content; backlight at minimum, midrange, and maximum duty; radio idle with transmit; motor stopped with switching; debugger attached with an isolated production-like state. Keep the touch configuration fixed during this pass.
One state change produces a repeatable shift in noise amplitude, frequency, channel location, or false-event rate.
The PCB, firmware filter, display cable, threshold, and enclosure ground all change in the same revision, making cause and effect unknowable.
3.6 Repair physical coupling before adding firmware delay
Inspect return paths, decoupling, controller supply, electrode and flex routing, proximity to PWM or display lines, connector grounds, shield/guard implementation, bezel geometry, and discontinuities in the bonded stack. TI and Microchip both describe series resistance, filtering, routing, shielding, and acquisition-frequency controls, but each component value must fit the selected device and layout.
A related EMI and ESD design review for capacitive touch panels should precede firmware compensation when the disturbance is electrical. A hardware spike that exceeds the valid-touch delta can defeat reasonable thresholds or force latency that the user interface cannot tolerate.
The source or coupling path is reduced before threshold and debounce are finalized.
A long moving average suppresses visible symptoms while raw data still saturates, jumps across several channels, or changes with cable position.
3.7 Tune baseline, threshold, hysteresis, and debounce together
These controls interact. Threshold determines how much delta is required. Hysteresis separates activation from release. Debounce or confirmation scans reject short excursions but add latency. Baseline update rules determine whether slow environmental movement is tracked, frozen, or reset. Frequency hopping, oversampling, IIR filtering, and dynamic thresholds may help on supported controllers, yet each changes response or processing behavior.
| Control | Intended job | Tradeoff to record | Wrong use |
|---|---|---|---|
| Detection threshold | Separate valid delta from no-touch movement | Weakest-touch margin versus worst-state noise | Lowered until a glove works without checking false-trigger margin |
| Hysteresis / release threshold | Prevent ON/OFF chatter near the decision point | Release effort, release time, and residual delta | Set so wide that a key remains latched |
| Debounce / confirmation | Reject brief threshold crossings | Added activation and release latency in scans and milliseconds | Extended to hide periodic hardware spikes |
| Baseline policy | Follow permitted slow environmental change | Drift tracking, freeze behavior, and recovery time | Allowed to follow a held touch or reset during an unresolved disturbance |
| Filtering / frequency strategy | Reduce bounded or frequency-dependent interference | CPU load, scan time, phase delay, and residual peaks | Used without identifying clipping, resets, or the coupling source |
ON margin, OFF margin, release behavior, baseline recovery, and measured response time are recorded together for each changed configuration.
Only the activation threshold is saved, or the same value is copied to electrodes with different area, routing, parasitic capacitance, and overlay geometry.
3.8 Separate glove detection from water rejection
Gloves usually reduce coupling and therefore reduce valid-touch delta. Water can increase apparent capacitance, bridge an electrode to a ground-referenced structure, or affect several channels at once. A water path from sensor to ground can look like touch, and a shield-to-ground water bridge can still cause false detection.
The requirement names the glove material and condition, then separately defines droplets, film, condensation, cleaning, or flowing-water states and the expected response in each.
“Works with gloves and water” appears as one checkbox with no geometry, duration, no-touch condition, permitted lockout, or recovery behavior.
3.9 Validate the enclosure and operating-state matrix
Run the final bonded assembly in its enclosure across the project’s actual power, display, load, communications, environmental, and user-contact states. Include boot and fault recovery. If the product specification invokes immunity testing, prepare traces and performance criteria before the laboratory session—not after a failure.
IEC 61000-4-2:2025 defines ESD immunity methods; IEC 61000-4-3:2020 addresses radiated RF fields from sources not in close proximity; IEC 61000-4-4:2012 addresses electrical fast transient/burst on ports; and IEC 61000-4-6:2023 covers conducted RF disturbances, normally 150 kHz to 80 MHz. The applicable product standard or customer specification decides which test applies, at what level, and with which performance criterion. A bench tuning pass is not EMC conformity.
Touch behavior and raw data are captured against a signed state matrix and applicable product requirement.
Room-temperature USB-powered bench operation is the only release evidence for a mains-powered enclosed product.
3.10 Define ownership and the release record
The physical sensor stack and firmware algorithm meet at a measurable interface. A panel or HMI supplier can review electrode geometry, lens/overlay, adhesive, air gaps, flex routing, shield/guard provisions, connector, display integration, and enclosure interface. The OEM’s controller and firmware team owns library settings, diagnostic firmware, application state logic, product risk decisions, and release configuration unless a contract explicitly assigns otherwise.
The release package contains hardware revisions, data logs, test matrix results, tuning file, firmware hash, open deviations, and named owners.
A supplier receives “fix the false touch” without the controller, firmware, waveform, operating state, stack drawing, or reproducible failure condition.
Framework closeout record
| Review block | Minimum record before the team proceeds | Named authority or tool |
|---|---|---|
| Build control | Sensor, overlay, adhesive, PCB/flex, display, enclosure, supply, and firmware revisions | OEM configuration system |
| Channel characterization | No-touch and deliberate-touch traces, window, scan rate, peak-to-peak noise, weakest signal, and per-state SNR | Infineon CAPSENSE Tuner, TI CapTIvate Design Center, Microchip MPLAB Data Visualizer, or controller-equivalent tool |
| Coupling isolation | Display, PWM, converter, charger, radio, motor, communications, debugger, earth, and cable A/B results as applicable | Controller trace plus oscilloscope or spectrum evidence where needed |
| Wet and glove behavior | Named glove; defined droplet, film, condensation, cleaning, or recovery state | Product requirement and OEM risk review |
| Immunity preparation | Applicable method, test level, operating mode, monitored channels, and performance criterion | IEC 61000-4-2:2025, IEC 61000-4-3:2020, IEC 61000-4-4:2012, or IEC 61000-4-6:2023 only where specified |
| Release | Tuning file, firmware hash, logs, test matrix, open deviations, and owners | OEM change-control and approval process |
4. Failure-chain map for touch sensor noise and false triggers
A useful failure chain connects the observed event to a trace pattern, a controlled isolation step, and an owner. It does not jump from symptom to threshold.
| Symptom | Trace signature to look for | First A/B isolation | Likely domain | Next action |
|---|---|---|---|---|
| Slow false activation after warm-up | Raw count drifts; baseline lags, freezes, or resets | Cold/warm capture with identical load and enclosure | Baseline policy, temperature, mechanics, contamination | Inspect stack movement and baseline rules; do not raise threshold until drift source is known |
| Periodic false touch | Peaks repeat at PWM, converter, display, or mains-related interval | Change backlight duty; display off/on; battery/intended supply | Display or power coupling | Reduce coupling/return-path problem, then remeasure noise |
| Failure only while a person touches the chassis | Several channels gain common-mode disturbance | Debugger attached/detached; grounded/floating enclosure | Earth path and common-mode coupling | Recreate production grounding; review shield, return path, and cable coupling |
| One channel is always noisy | Localized ripple or low delta; neighbors normal | Swap flex/assembly where design permits; inspect route and connector | Electrode, trace, connector, assembly defect | Check geometry, damage, bond, contamination, and adjacent switching route |
| Neighbor activates with intended key | Two deltas rise together; secondary channel crosses threshold | Touch at center/edge; inspect spacing and suppression logic | Geometry, parasitic coupling, threshold policy | Review electrode spacing/routing and controller’s adjacent-key logic |
| Capacitive touch false trigger after a droplet | Multi-channel or localized sustained delta, often near ground feature | Defined droplet/film test on clean final surface | Water bridge, guard/shield geometry, firmware policy | Define wet behavior; review water path and recovery logic |
| Bare finger passes; required glove misses | Valid delta shrinks but idle noise may not | Named glove versus bare finger under same state | Signal margin, overlay stack, electrode geometry | Improve physical signal if possible before lowering threshold |
| Missed touch during radio, motor, or charger operation | Bursts or noise bands align with aggressor state | Aggressor idle/active at fixed touch settings | Conducted/radiated interference | Apply vendor hardware and acquisition-frequency guidance; validate latency |
| Failure appears only with debugger | Baseline/noise changes when PC cable is attached | Production power and isolated logging comparison | Altered ground/cable path | Measure in representative production state; use isolated observation if needed |
The failure chain also sets a stop condition. If raw readings clip, communication drops, the controller resets, or many channels move together during an aggressor event, sensitivity tuning should stop. The team should investigate power integrity, grounding, EMC coupling, or controller operation before modifying touch thresholds.
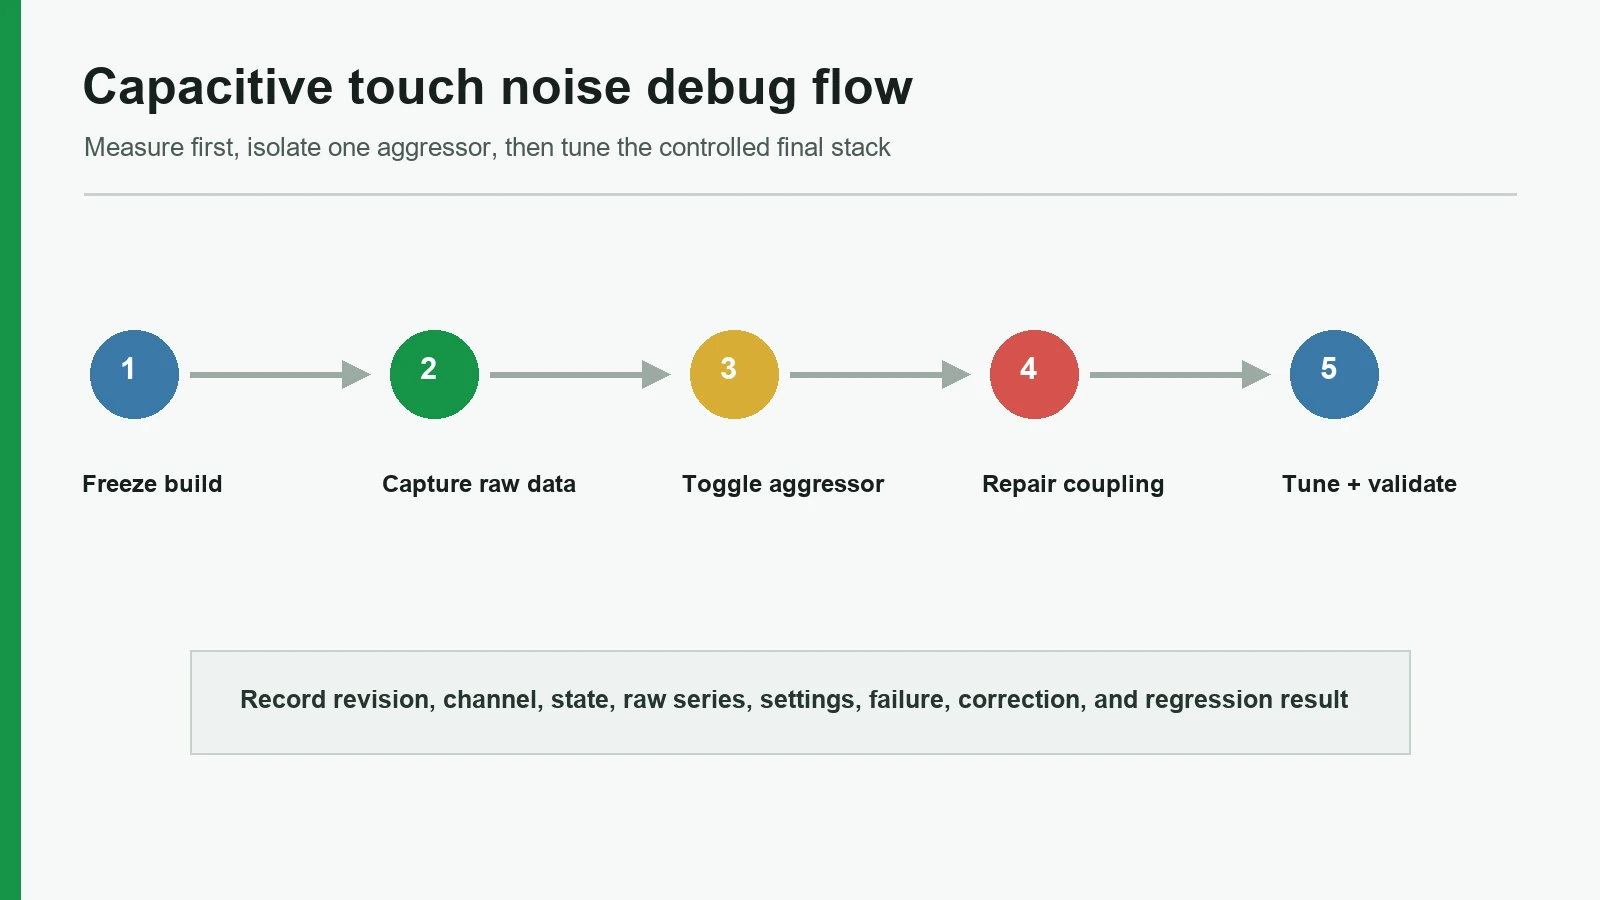
5. A seven-step capacitive touch controller tuning process
This sequence keeps hardware corrections ahead of firmware polish and produces an auditable result.
Step 1 — Freeze the build and failure statement
Assign revision identifiers to the sensor stack, PCB/flex, display, enclosure, controller library, firmware, tuning file, and power configuration. Write the failure as an observable condition: for example, “channel 3 reports ON during 20% backlight PWM with no user contact,” not “sensitivity is bad.”
Step 2 — Export untouched channel data
Capture all channels in stable no-touch states. Use approximately 500 samples per state for the first controller-scoped characterization, with scan rate and dwell time recorded. Include minimum, maximum, peak-to-peak noise, mean or median, baseline behavior, and every touch-state transition.
Step 3 — Measure deliberate-touch signal
Use the intended overlay, contact method, and representative positions. Record the weakest valid delta, not only the strongest touch. Calculate SNR from touch and no-touch data captured with the same method and state. Compare the 5:1 controller screen separately from the project’s released criterion.
Step 4 — Isolate the aggressor
Toggle one source at a time: supply, charger, display content, backlight PWM, communications, radio, motor, relay, processor load, debugger, earth connection, and enclosure bond. Preserve the controller settings. Frequency and state correlation usually separates random assumptions from a repeatable coupling path.
Step 5 — Correct stack, routing, power, or grounding defects
Repair adhesive gaps, damaged shields, connector faults, route proximity, poor returns, display/flex placement, or supply problems before adding filter delay. If the physical interface is still changing, return to Step 1. The custom capacitive touch panel design guide provides the related stack and geometry context.
Step 6 — Tune controller parameters with latency visible
Adjust acquisition settings and, where supported, threshold, hysteresis, baseline behavior, confirmation scans, filters, oversampling, and frequency strategy. Change one related set at a time. Save each configuration and measure both touch margin and response/release time. Reject settings that hide a disturbance by making the interface too slow or causing missed intended touches.
Step 7 — Run the state matrix and release the record
Repeat no-touch, intended-touch, edge, glove, water, display, power, enclosure, and recovery states defined by the product team. Add applicable pre-compliance or laboratory results without calling them product approval. Release the chosen configuration with logs, versions, deviations, and owners.
6. Final-system test matrix
The state matrix should be project-specific. The rows below are a starting structure, not a universal test specification.
| Test family | Controlled states | Evidence to retain | Decision boundary |
|---|---|---|---|
| Power | Battery/bench source if applicable; intended supply; charger; low/high operating input | Per-channel raw, baseline, delta, noise, resets | Supply-related movement is fixed before threshold release |
| Display and lighting | Display off/on; static/high-transition patterns; backlight minimum/mid/maximum and relevant PWM modes | Noise spectrum or time trace tied to display state | Display coupling stays below approved no-touch margin |
| System load | Processor idle/load; communications idle/active; radio transmit; motor/relay states as applicable | Timestamped aggressor state and touch trace | No unexplained state-correlated threshold crossing |
| Grounding and cables | Final enclosure bond; intended earth; service cable; debugger attached/detached | Connection diagram and comparative trace | Release uses representative production grounding |
| Touch | Center/edge; repeated actuation; required approach; simultaneous/adjacent behavior | Weakest valid signal, ON/OFF margin, response/release time | Meets the product’s functional acceptance criteria |
| Glove | Each named glove, dry and other specified condition | Glove identifier, fit/condition, repeated delta | Evaluated separately from water rejection |
| Water/contamination | Defined droplets, film, condensation, cleaning, residue, or no-touch wet state | Application method, location, duration, response, recovery | Behavior matches written wet-state policy; no implied IP claim |
| Environment | Specified temperature/humidity dwell and transitions | Stabilization time, baseline movement, recovery | Baseline tracks allowed drift without following valid touch |
| Immunity preparation | Applicable IEC 61000-4 method and product criterion, if specified | Test plan, mode, monitoring method, pass/fail criteria | Product standard/customer specification governs; bench tuning alone does not pass |
Use the organization’s approved validation plan and quality and testing capabilities to turn this structure into fixtures, sampling, records, and product-specific criteria. A table in a blog is not a substitute for a controlled test procedure.
7. Inputs to share with hardware and firmware teams
A useful support package lets each team reproduce the same capacitive touch false trigger or missed-touch condition.
- Controller part number, sensing method, library/tool version, and configuration export
- Firmware revision or hash, scan rate, acquisition settings, threshold, hysteresis, debounce, filter, and baseline parameters
- Sensor drawing, electrode dimensions, spacing, route/flex drawing, connector pinout, shield/guard definition, and ground strategy
- Overlay or cover-lens material and thickness, print layers, adhesive stack, air-gap limits, display spacing, bezel, and enclosure drawing
- Raw channel log with raw count/measure, baseline/reference, delta, state, channel, and timestamps
- Exact failure condition: power source, display/backlight state, communications/load, debugger, earth, temperature/humidity, water, glove, and user contact
- Photos or video synchronized to the data where they clarify the event
- Test requirement, applicable standard/customer clause, acceptance criterion, and open deviation list
For an integrated build, the same package can support review of capacitive-touch HMI assemblies. The request should identify the physical stack question separately from the controller-firmware question.
8. Release blockers that stop release
- No raw channel export — binary event logs cannot show baseline, delta, or threshold margin.
- Tuning on nonrepresentative mechanics — an open sensor does not characterize the bonded, enclosed product.
- Several variables changed together — the next pass cannot identify which change worked.
- Threshold used to hide clipping or resets — the symptom is not a sensitivity problem.
- One value copied to every channel — electrode and parasitic differences remain unmeasured.
- Glove and water combined into one test — weak-signal detection and conductive bridging require different decisions.
- Debugger-only evidence — the observation cable may alter the ground path identified by TI guidance.
- Bench pass called EMC compliance — IEC applicability, levels, setup, and criteria come from the product requirement.
9. Frequently asked questions
What is capacitive touch controller tuning?
Capacitive touch controller tuning is the measured adjustment of acquisition, baseline tracking, detection threshold, hysteresis, debounce, filtering, and related parameters for a defined sensor stack and operating environment. It starts with raw channel data and ends with a versioned configuration validated against the product’s state matrix.
What should be logged when debugging touch sensor noise?
Log timestamped raw count or measure, baseline or reference, delta, touch state, channel, scan rate, and controller settings. Add power source, display/backlight mode, system load, debugger/ground state, enclosure revision, temperature/humidity condition, glove, and water state so a reviewer can correlate noise with a physical event.
What SNR is acceptable for a capacitive touch sensor?
Infineon AN85951 recommends at least 5:1 SNR for its CAPSENSE designs, using touch signal divided by peak-to-peak no-touch noise. That is a useful initial screen, not a universal acceptance limit. The selected controller guidance and product requirement must define the final method and margin.
What usually causes a capacitive touch false trigger?
Common mechanisms include a threshold below observed noise, display or PWM coupling, supply ripple, common-mode ground movement, radio/motor/relay bursts, adjacent-electrode coupling, water bridging, contamination, stack movement, and unsuitable baseline behavior. The raw trace and controlled A/B state—not the symptom alone—separate these causes.
Should sensitivity be increased to make a touch panel work through gloves?
Not automatically. A glove can reduce valid-touch delta, so first measure the weakest glove signal against worst-state no-touch noise. Review electrode geometry and the overlay stack before lowering thresholds. A setting that detects the glove may also admit water, adjacent-channel coupling, or display noise.
How should water and glove testing differ?
Glove testing verifies intended weak-signal detection with a named glove and contact method. Water testing verifies behavior during defined droplets, film, condensation, cleaning, or flow, including no-touch states and recovery. Microchip AN2934 shows why a water bridge to ground-referenced structure can resemble touch; the two tests are not interchangeable.
Can debounce fix a capacitive touch false trigger?
Debounce can reject short excursions by requiring multiple qualifying scans, but it adds response time and does not correct a persistent coupling path. If the raw data clips, resets, or stays above threshold, investigate power, grounding, routing, display, stack, or water effects before extending debounce.
When is touch panel sensitivity tuning complete?
Touch panel sensitivity tuning is complete when the approved hardware and firmware revision passes the project’s no-touch, intended-touch, release, latency, display, power, load, enclosure, environmental, glove, water, and applicable immunity states. The released record should include raw logs, configuration, versions, criteria, deviations, and ownership.
Technical References
- Source: Infineon AN85951 CAPSENSE Design Guide. Accessed 2026.
- Source: Infineon AN241195 CAPSENSE Manufacturing Test Recommendations. Accessed 2026.
- Source: STMicroelectronics AN4316 Touch Sensing Tuning Guide. Accessed 2026.
- Source: Microchip CAP1XXX Controller Tuning Guide AN2034. Accessed 2026.
- Source: Texas Instruments CapTIvate Technology Guide. Accessed 2026.
- Source: IEC 61000-4-6:2023 Conducted RF Immunity. Accessed 2026.
- Source: PSoC 4 and PSoC 6 MCU CAPSENSE Design Guide (AN85951). Accessed 2026.
- Source: ModusToolbox CAPSENSE Tuner User Guide. Accessed 2026.
- Source: Manufacturing Test Recommendations for PSoC 4 CAPSENSE Designs (AN241195). Accessed 2026.
- Source: Guide to Tune Touch Sensors. Accessed 2026.
- Source: Noise Tuning. Accessed 2026.
- Source: CAP1XXX Touch Key Controller Tuning Guide (AN2034). Accessed 2026.
- Source: Capacitive Touch Sensor Design (AN2934): Moisture Tolerance. Accessed 2026.
- Source: CapTIvate Technology Design Guide. Accessed 2026.
- Source: How to Tune Touch Sensing Applications on STM32 MCUs (AN4316). Accessed 2026.
- Source: How to Improve Conducted Noise Robustness (AN4299). Accessed 2026.
- Source: IEC 61000-4-2:2025. Accessed 2026.
- Source: IEC 61000-4-3:2020. Accessed 2026.
- Source: IEC 61000-4-4:2012. Accessed 2026.
- Source: IEC 61000-4-6:2023. Accessed 2026.
Review the complete capacitive touch stack before release
Send the cover, artwork, active area, display, electrode, controller, tail, environment, and acceptance states for an engineering review.