
A force sensing resistor (FSR) is a thin, passive, two-terminal sensor whose resistance normally falls as force on its active area increases. It suits compact products that need touch, presence, relative-force, or threshold detection. It is not automatically a precision force transducer: the actuator, support, contact area, circuit, temperature, dwell time, and calibration all affect the result. For an OEM deciding whether a custom FSR seat pressure sensor fits a design, the key boundary is simple: choose an FSR when a thin, mechanically controlled force-related signal is more important than traceable absolute accuracy.
What Is a Force Sensing Resistor Sensor?
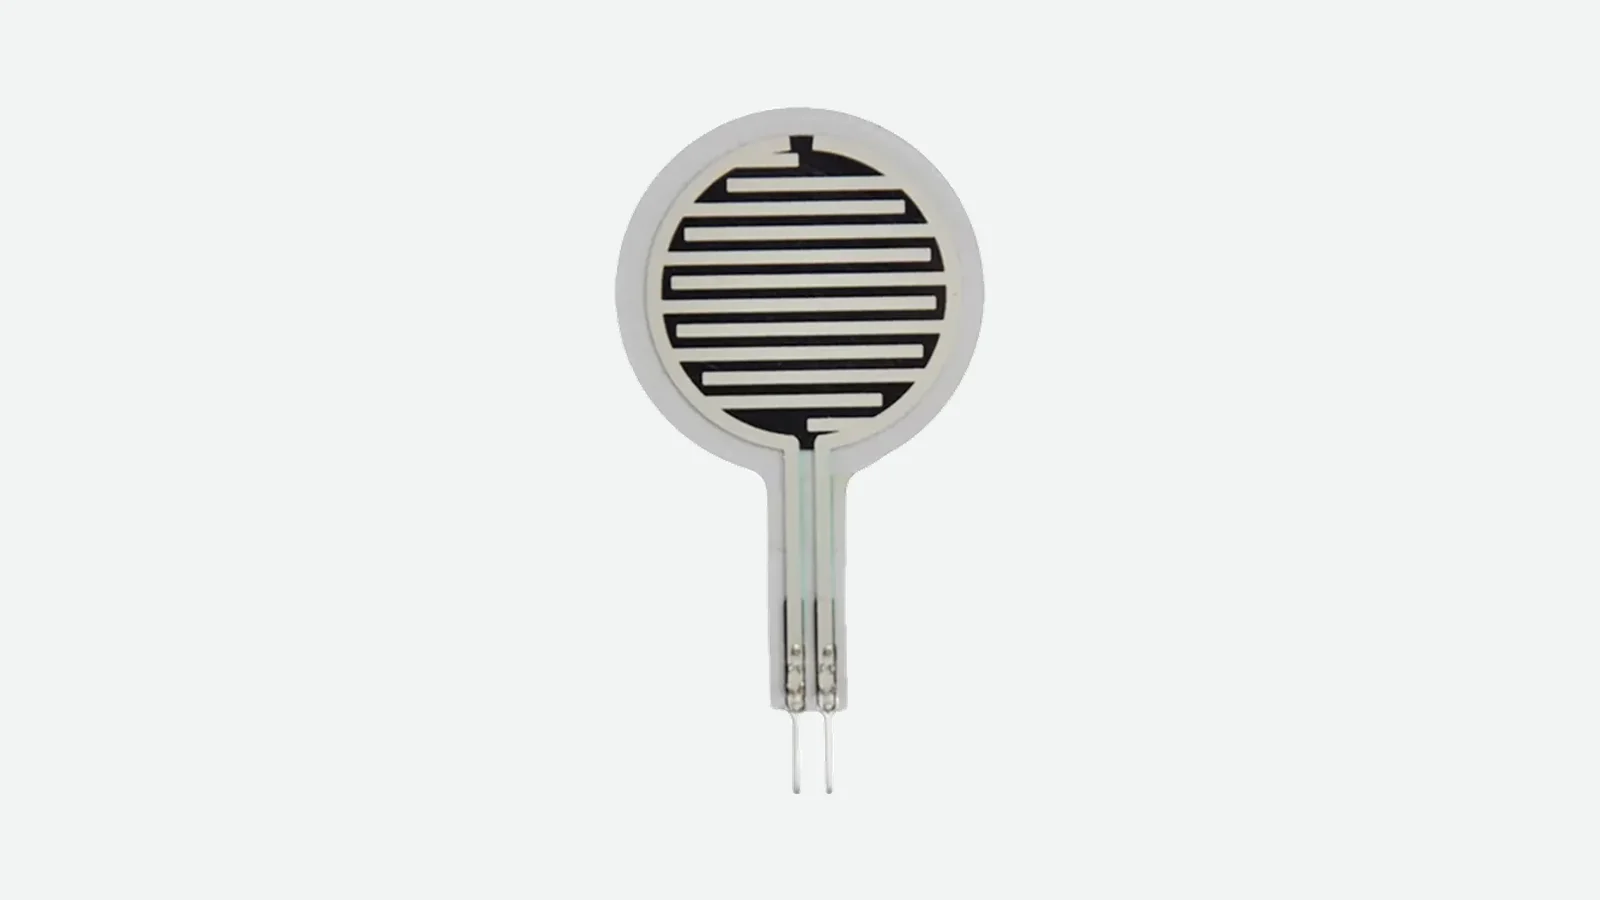
The search phrase “what is force sensing resistor” usually refers to a force-sensitive resistor: a passive component that converts mechanical loading into a resistance change. Unlike a load cell, it does not generate a calibrated force value. Unlike a contact switch, it provides a continuous electrical variable rather than only open or closed states.
Most commercial FSRs are flexible polymer devices with an active area, two terminals, and a thin tail. Load changes conductive contact inside that area, creating more effective current paths as force rises. Interlink Electronics’ FSR 400 integration guide and Sensitronics’ FSR 101 guide describe this behavior across different constructions and terminology.
An FSR is often called a thin film pressure sensor, but the label can obscure the measurand. Force is measured in newtons. Pressure is force divided by area, expressed in pascals, where 1 Pa = 1 N/m². Two fixtures can apply the same total force yet produce different readings if one concentrates the load in a small puck and the other spreads it across foam. An FSR therefore senses the load transferred through its particular contact geometry; it does not measure pressure independently of area and mechanics.
That distinction matters in seat cushions, control panels, clamps, and grippers. Foam stiffness, trim tension, curvature, preload, actuator diameter, and support deflection can all change the fraction of the external load that reaches the active area.
Force Sensing Resistor Construction: What Is Inside the Stack?
There is no single universal FSR stack. Two common families are shunt-mode and thru-mode constructions, terms documented in Sensitronics’ FSR 101 guide. Both use force-sensitive resistive material, but they arrange the electrodes and current path differently.
A common shunt-mode stack can be represented this way:
Applied normal load
Actuator, puck, foam, or load spreader
Protective polymer film
Force-sensitive resistive ink
increasing contact under load
Spacer / controlled gap around active zone
Interdigitated conductive electrodes
Flexible substrate and two-terminal tail
Adhesive and stable support surface
In this arrangement, the force-sensitive layer bridges more of the interdigitated electrode pattern as loading increases. The effective resistance between the two terminals falls. Electrode pitch, ink formulation, spacer geometry, active-area shape, and actuator mechanics all affect the curve.
A thru-mode design places conductive or force-sensitive material between opposing electrodes, so current passes through the thickness of the active stack. The mechanical principle remains similar—compression changes the available conduction paths—but its geometry and response need their own characterization. A specification should name the selected construction or part number rather than treating “FSR” as a complete drawing definition.
The sensing area and tail also perform different jobs. Normal force belongs on the defined active zone. Sharp folds, connector pull, repeated rubbing, or clamp pressure on the tail can damage traces or create unstable resistance unrelated to the intended measurement. Tail bend radius, strain relief, connector orientation, and keep-out zones belong on the assembly drawing.
How FSR Works: From Applied Force to an Electrical Decision
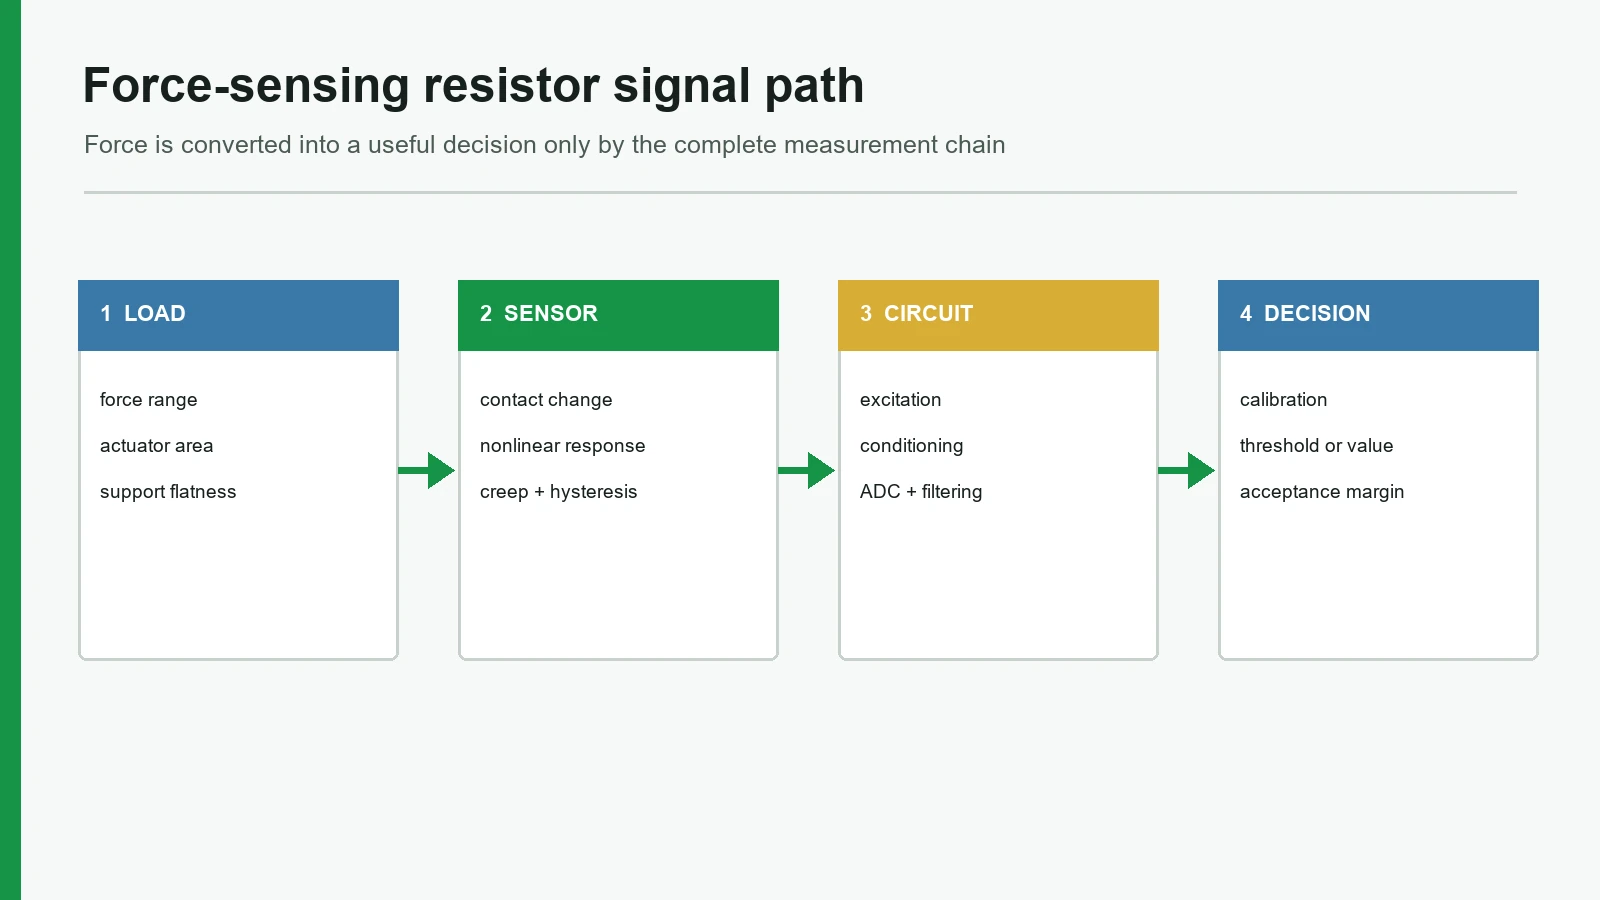
An FSR changes resistance; it does not produce a voltage by itself. The complete signal path has at least five stages:
External load
controlled mechanical interface
force-dependent FSR resistance
divider or conductance-measuring circuit
ADC / comparator / controller
calibrated estimate, band, or threshold decision
At the material level, the behavior is more complicated than “pressure closes a switch.” A 2017 Sensors paper by Paredes-Madrid and colleagues models contact resistance and quantum-tunneling mechanisms rather than an ideal linear resistor (DOI 10.3390/s17092108). Commercial inks differ, but the engineering rule holds: do not assume a straight-line force-to-resistance conversion.
A typical response has three practical regions:
- Unloaded or near-threshold region. Resistance is high and may be difficult to distinguish from an open circuit. Small changes in contact or preload can create large percentage changes.
- Useful operating region. Resistance decreases with increasing force, often following a nonlinear power-like curve. Circuit sensitivity and the mechanical interface determine usable resolution.
- Saturation region. Additional force produces progressively less electrical change. Operating too close to this region reduces decision margin.
Reading an FSR with a voltage divider
One simple interface places the FSR above a fixed reference resistor:
Vcc · FSR · Vout to ADC
Rref
GND
For that topology:
Vout = Vcc × Rref / (RFSR + Rref)
As force increases and RFSR falls, Vout rises. Reversing the FSR and Rref reverses the voltage direction. The reference resistor should be chosen around the resistance region the application needs to resolve, not copied from a tutorial with a different load range.
A transimpedance or conductance-measuring op-amp circuit can provide a more useful transfer function over a selected range. Tekscan’s electrical integration guidance covers circuit sensitivity, conditioning, headroom, and multipoint calibration. In either circuit, source voltage, ADC reference, input leakage, sampling interval, filtering, and current limits belong to the measurement definition.
The output should match the product decision. A seat or clamp may only require unloaded, transition, and loaded bands. Converting every ADC sample into newtons can add false precision when a validated threshold with separate activation and release limits would be more dependable.
Thickness, Repeatability, Hysteresis, and Drift Need Test Conditions
FSR specifications are easy to quote and easy to misuse. Thickness describes packaging, not measurement quality. Repeatability is not the same as part-to-part interchangeability. Hysteresis compares loading and unloading paths. Drift describes change with time under a nominally constant condition. Each metric needs a fixture, load, circuit, timing, sample history, temperature, and calculation method.
Published product examples use different constructions, actuators, circuits, and test conditions. Treat each value as product-specific evidence, not a universal FSR limit or a JASPER specification.
| Metric | Interlink FSR 400 Series published example | Tekscan FlexiForce A201 published example | Design interpretation |
|---|---|---|---|
| Nominal thickness | About 0.30–0.53 mm across listed 400-series geometries | 0.203 mm (0.008 in.) | Specify the selected model, tolerance, adhesive, and compressed stack—not “thin” alone. |
| Repeatability | ±2% for one part under stated conditions; ±6% part-to-part within one lot | <±2.5% typical for a conditioned sensor | A single-part result does not prove interchangeability across production units. |
| Hysteresis | Approximately 10% average | <4.5% of full scale, typical | Run ascending and descending loads in the final fixture. |
| Drift | <5% per decade of time in the stated 1 kg, 35-day test | <5% per logarithmic time, typical | “Per logarithmic time” is not “per hour”; test the real dwell window. |
| Linearity | Force–resistance response is nonlinear; overall force accuracy depends strongly on the system | <±3% full scale, typical with stated circuit/test conditions | Never transfer one model’s fitted curve or error claim to another stack. |
Sources: Interlink FSR 400 Series datasheet and Tekscan FlexiForce A201 specifications.
Repeatability is a system property
A “±2%” line can describe repeated readings from one conditioned part in one controlled fixture. It does not prove interchangeability after installation under changing preload. Separate repeated cycles on one assembly, sensor-to-sensor variation, and completed-assembly variation.
Hysteresis changes the threshold margin
At the same nominal force, the output can differ depending on whether the load approached from below or above. If a controller uses one threshold for both activation and release, noise and mechanical movement can cause chatter. Separate on/off thresholds may help, but firmware cannot repair a load path that moves off the active area.
Creep and drift matter under held loads
The 2017 Materials study by Paredes-Madrid and colleagues evaluated 32 FSR specimens under creep and dynamic loading. It found time-dependent behavior tied to loading history and electrical conditions (DOI 10.3390/ma10111334; open-access record). A 30-second press test is therefore weak evidence for a seat, clamp, or fixture that stays loaded for 4 hours. The validation dwell must resemble the intended decision window, followed by a recovery check after unloading.
Mechanical Integration Usually Sets the Measurement Ceiling
A better calibration equation cannot compensate for uncontrolled load transfer. Interlink and Tekscan both emphasize actuator geometry, support stiffness, load position, interface materials, and final-assembly calibration.
Use a stable backing
The support under the active area should remain predictable across the specified load and temperature range. A flexible housing can absorb part of the applied force. A trapped particle can create a local preload. A curved mounting surface can bend the sensor before the intended load arrives.
Define the actuator or load spreader
A puck or boss can concentrate load into a controlled portion of the sensing area. Its diameter, hardness, edge radius, alignment, and travel should be fixed. If it is too small, local stress rises. If it bridges the inactive border, surrounding adhesive or structure may carry part of the load. Tekscan’s mechanical integration guidance recommends controlling the loaded region rather than pressing unpredictably across the full laminate.
Control preload, shear, and overtravel
Foam, trim, gaskets, and assembly compression may load the sensor at zero external input. Measure that preload and include it in the calibration. Guide moving parts so force reaches the active area mainly as normal compression; sliding can shift the contact patch or wear the laminate. A mechanical stop should carry excess travel when overload is possible—the sensor should not serve as the structure’s end stop.
Freeze interface materials before calibration
Changing foam density, adhesive thickness, elastomer hardness, cover film, support plastic, or housing tolerance after calibration can shift the force transfer. The controlled bill of materials should include these layers, even when they are not part of the purchased sensor.
How Should an FSR Be Calibrated and Validated?
Calibration starts with a measurable product decision. “Accurate pressure sensing” is not sufficient. “Change to the occupied state under the agreed seat-load condition, remain stable during the specified dwell, and release within the defined unload window” can be tested.
Force-transducer calibration establishes the relationship between known applied forces and transducer output. When the customer readout is included, that relationship applies to the transducer-and-readout combination. The same system principle matters here: an FSR curve belongs to the sensor, mechanics, circuit, timing, and fitted model used to create it.
A practical OEM process is:
- Define the output. Choose a binary state, relative band, trend, multi-zone pattern, or estimated force.
- Build the representative stack. Use intended support, actuator, adhesive, foam, cover, connector, circuit, and firmware sampling.
- Condition consistently. Follow the selected sensor manufacturer’s procedure. Tekscan and Interlink publish product-specific conditioning guidance; do not combine procedures casually.
- Apply traceable reference loads. Cover the actual operating window, not the sensor’s entire catalog range by default.
- Measure loading and unloading. Repeat cycles to expose hysteresis and short-term repeatability.
- Add dwell and recovery. Hold representative loads for the intended duration, unload, and record the return toward baseline.
- Vary parts and assemblies. Include several sensors, manufacturing stack tolerances, electronics, and fixture builds.
- Challenge the environment. Select temperature, humidity, vibration, fluid exposure, or aging conditions from the product risk analysis.
- Set acceptance limits. Define decision margin, error, false-transition behavior, out-of-range handling, and recalibration triggers.
- Validate production-representative units. Use the same drawing revision, BOM, assembly process, and software intended for release.
Application-representative FSR test matrix
| Test | Controlled input | Record | Decision boundary |
|---|---|---|---|
| Zero/preload | Completed assembly with no intended external load | Baseline resistance or ADC distribution | Baseline stays outside activation margin across tolerances |
| Ascending force | Reference loads from minimum to maximum operating condition | Output at each point and fitted residual | Required resolution or state separation is met |
| Descending force | Same points in reverse order | Loading/unloading difference | Hysteresis fits the error or threshold budget |
| Repeat cycling | Defined rate, contact geometry, and cycle count | Cycle-to-cycle spread and baseline shift | No decision chatter or unacceptable spread |
| Dwell | Representative constant load and duration | Output versus logarithmic time | Drift does not cross a state or force-error limit |
| Recovery | Unload after dwell | Time and residual offset | System returns inside the release/baseline window |
| Contact-position tolerance | Worst-case actuator offsets | Sensitivity and state margin | Assembly tolerance cannot create a false decision |
| Stack variation | Foam, adhesive, housing, and preload tolerance limits | Between-assembly distribution | Production window remains inside acceptance limits |
| Environmental challenge | Risk-based temperature/humidity/other condition | Baseline, sensitivity, drift, physical condition | Product requirement remains met under stated condition |
The quality and testing route can support a broader validation discussion, while prototyping should freeze the mechanical interface before firmware thresholds or production tooling are released. A listed capability page does not replace the project-specific test plan or an approved report.
FSR vs Load Cell vs Contact Membrane Sensor
The recommended construction depends on what the product must decide. “Thin” favors an FSR, but thinness does not override metrology or safety requirements.
| Decision factor | Force sensing resistor | Strain-gauge load cell | Contact-type membrane sensor |
|---|---|---|---|
| Output | Nonlinear resistance related to transferred load | Bridge signal related to strain in a designed structure | Discrete open/closed state |
| Strong fit | Thin relative-force, presence, band, or threshold sensing | Calibrated absolute force or weight with controlled load path | Simple pressed/not-pressed or occupied/unoccupied decision |
| Mechanical need | Stable backing and controlled actuator still required | Designed load-bearing flexure and controlled mounting | Defined actuation zone and travel |
| Electronics | Divider, op-amp conductance circuit, ADC, or comparator | Excitation, instrumentation amplifier, ADC | Digital input or continuity circuit |
| Calibration | Final-stack characterization strongly advised | Formal zero/span or multipoint system calibration | Threshold and travel validation |
| Static-load concern | Creep and drift can limit long dwell accuracy | Usually better characterized for stable absolute measurement | State may remain closed without analog force information |
| Packaging | Very thin and flexible options exist | Typically thicker and structurally constrained | Thin laminated construction |
| Not the best choice when | Traceable precision, low drift, or uncontrolled contact is required | No rigid load path or thickness budget exists | Continuous force information is required |
An FSR is not the best choice for legal-for-trade weighing, traceable laboratory force, tight absolute accuracy across changing contact geometry, or long-held loads with little allowable drift. Start with a strain-gauge load cell for those requirements. If only a state change is needed, a contact membrane sensor or seat occupancy sensor architecture may eliminate analog circuitry and calibration.
Where Does a Thin Film Pressure Sensor Fit in OEM Products?
A thin FSR can fit compact interfaces where the mechanical stack can be controlled:
- Seat and presence detection: A force-related output can help distinguish unloaded and loaded states, but foam, trim, posture, preload, and dwell must be represented. In automotive applications, the sensor is one component; the seat or vehicle integrator remains responsible for control logic, safety analysis, compliance, and vehicle-level validation.
- HMI press intensity: A panel can distinguish touch bands or add a deliberate-force threshold where a simple contact switch is insufficient.
- Clamp and grip monitoring: A fixture can detect relative closure force when actuator position and contact geometry repeat.
- Part-presence confirmation: A nest can confirm that a component reaches a loaded position without adding a bulky transducer.
- Flexible multi-zone sensing: Several active areas can compare relative loading, provided cross-talk, routing, and calibration are addressed.
The construction is a poor fit when the contact point can wander beyond the active area, side load dominates, or the system cannot preserve its calibrated stack. Redesigning the load path then matters more than selecting another resistance curve.
What Information Should an OEM Provide for an FSR Review?
A useful requirement package describes the sensing chain, not only the active-area diameter.
| Input | Include in the drawing or requirement | Why it changes the result |
|---|---|---|
| Product decision | State, force band, trend, or estimated force; activation/release logic | Sets the required resolution and validation method |
| Geometry | Outline, active area, tail exit, keep-outs, holes, bend radius, connector | Defines fit and load alignment |
| Load case | Minimum/nominal/maximum force, contact area, rate, dwell, preload, off-axis load | Establishes the operating window and failure conditions |
| Mechanical stack | Actuator, foam, cover, adhesive, backing, housing, travel stop | Controls force transfer and repeatability |
| Electrical interface | Supply, divider/op-amp topology, ADC range, sample rate, filtering, current limit | Converts resistance into usable signal and sets resolution |
| Environment | Temperature, humidity, fluids, cleaning, vibration, storage | Selects qualification stresses and materials |
| Variation plan | Sensor count, stack tolerances, assembly builds, lot strategy | Separates one-sample behavior from production capability |
| Acceptance evidence | Calibration points, error/threshold margin, dwell, recovery, cycle and report needs | Defines when the sample passes |
Before requesting a production quotation, review the load path and acceptance matrix with the selected sensor manufacturer. JASPER can be considered as one option to review a custom FSR sensor requirement through the FSR seat pressure sensor page. No company-specific performance should be accepted until it appears on an approved drawing, specification, or test report.
Frequently Asked Questions
Is an FSR the same as a pressure sensor?
No. An FSR's resistance changes as the applied load changes, while pressure is force divided by area. A thin film pressure sensor can estimate pressure only when contact area, load distribution, mechanics, circuitry, and calibration are defined for that measurement.
Can a force sensing resistor measure weight accurately?
An FSR can produce a calibrated output related to weight in a controlled fixture, but it is not automatically a precision scale. If traceable absolute accuracy, low hysteresis, and long-term stability are primary requirements, a strain-gauge load cell is usually the stronger starting point.
Why does FSR resistance decrease when force increases?
Applied force increases effective conductive contact within the active material and electrode interface. The exact mechanism depends on construction; research on conductive-polymer FSRs includes contact resistance and quantum-tunneling effects. The resulting force–resistance curve is generally nonlinear.
Why does an FSR reading drift under a constant load?
Time-dependent changes can arise in the force-sensitive material and in the surrounding mechanical stack, including foam, adhesive, elastomer, or housing deformation. Circuit conditions and temperature may contribute. Test the complete assembly for the intended dwell and recovery periods before setting thresholds.
How thick is a force sensing resistor sensor?
Thickness depends on the selected model and excludes or includes different stack items. Published examples include 0.203 mm for Tekscan A201 and approximately 0.30–0.53 mm across listed Interlink FSR 400-series geometries. Adhesive, covers, connectors, tolerances, and compression still need drawing control.
Does an FSR need calibration?
Yes, when the output supports a force estimate, band, or dependable threshold. Calibrate after reproducing the intended actuator, support, interface materials, circuit, timing, and environment. A generic datasheet curve is useful for circuit planning but does not replace final-assembly characterization.
Can one calibration curve be used for every FSR assembly?
Only if a multi-part, multi-assembly study proves that the resulting error or decision margin is acceptable. Part variation, preload, actuator position, foam, adhesive, support, electronics, temperature, and loading history can shift the response. Some products need individual calibration; others can use validated limits or family curves.
When should a load cell be used instead of an FSR?
Use a load cell when the requirement centers on calibrated absolute force or weight, traceability, lower drift, better linearity, or a defined accuracy budget. Use an FSR when thin packaging, flexibility, relative-force response, or threshold detection matters more and the load path can be controlled.
Review the Requirement Before Selecting the Sensor
Start with the product decision, load path, dwell, contact geometry, circuit, and acceptance test. Those inputs determine whether an FSR, contact membrane sensor, multi-zone mat, or strain-gauge load cell is defensible. A sensor should be selected after that boundary is clear—not before it.
Technical References
- Source: NIST calibration of force transducers. Accessed 2026.
- Source: Interlink FSR 400 Series integration guide. Accessed 2026.
- Source: Tekscan FlexiForce integration guidance. Accessed 2026.
- Source: Sensors 2017 conductive polymer FSR static-loading study. Accessed 2026.
- Source: Materials 2017 FSR creep and dynamic-loading study. Accessed 2026.
- Source: Interlink Electronics’ FSR 400 integration guide. Accessed 2026.
- Source: Sensitronics’ FSR 101 guide. Accessed 2026.
- Source: DOI 10.3390/s17092108. Accessed 2026.
- Source: Tekscan’s electrical integration guidance. Accessed 2026.
- Source: Interlink FSR 400 Series datasheet. Accessed 2026.
- Source: Tekscan FlexiForce A201 specifications. Accessed 2026.
- Source: DOI 10.3390/ma10111334. Accessed 2026.
- Source: open-access record. Accessed 2026.
- Source: NIST describes force-transducer calibration. Accessed 2026.
- Source: Interlink Electronics, FSR 400 Series Integration Guide. Accessed 2026.
- Source: Interlink Electronics, FSR 400 Series Datasheet. Accessed 2026.
- Source: Tekscan, FlexiForce Integration Guides. Accessed 2026.
- Source: Tekscan, FlexiForce A201 Sensor Specifications. Accessed 2026.
- Source: Sensitronics, FSR 101: Force Sensing Resistor Theory and Applications. Accessed 2026.
- Source: Paredes-Madrid et al., “Underlying Physics of Conductive Polymer Composites and Force Sensing Resistors (FSRs) under Static Loading Conditions,” Sensors, 2017. Accessed 2026.
- Source: Paredes-Madrid et al., “Underlying Physics of Conductive Polymer Composites and Force Sensing Resistors (FSRs). A Study on Creep Response and Dynamic Loading,” Materials, 2017. Accessed 2026.
- Source: NIST, Calibration of Force Transducers. Accessed 2026.
Review the complete FSR measurement chain
Send the force range, actuator, support, circuit, timing, environment, dimensions, and required decision output.