
Seat pressure sensor drift should be evaluated as an installed-system change, not as one unexplained percentage. Seat-system engineers need to separate the sensing film, foam, adhesive, preload, electronics, and calibration sequence, then judge each contribution against the empty/occupied decision margin.
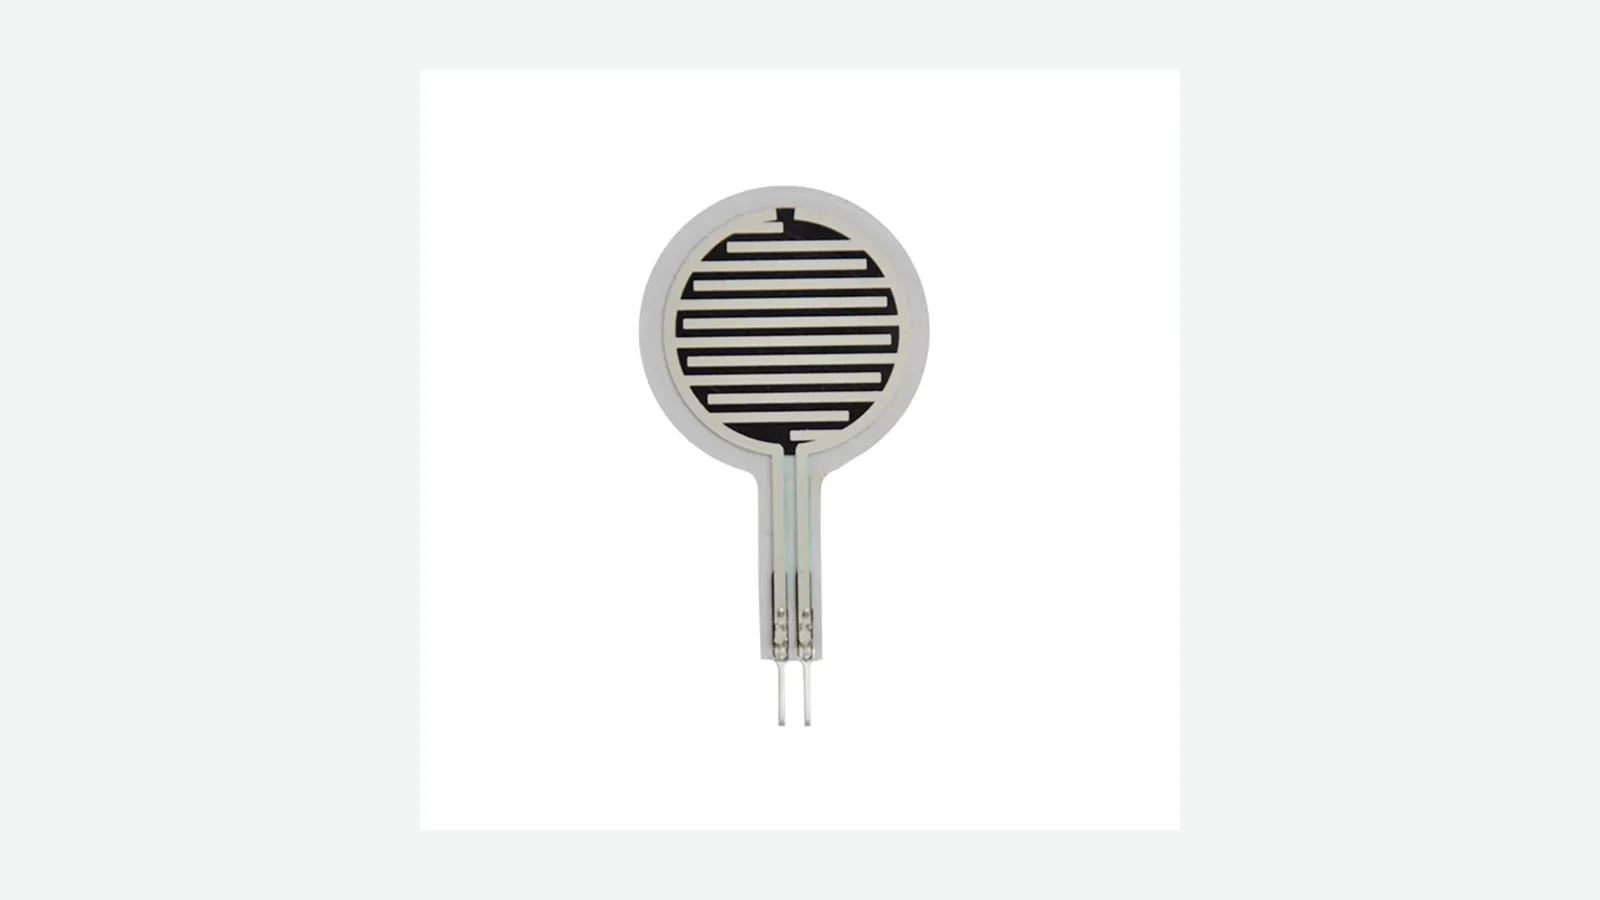
A useful drift study answers three questions: what changed, under which load-temperature-time history, and whether the change can move the system across a decision boundary. This guide is for seat engineers, validation teams, and technical buyers evaluating a flexible FSR seat pressure sensor. It does not set a universal automotive limit. Instead, it shows how to build a test sequence that distinguishes reversible temperature response from time-dependent creep and permanent aging before calibration conceals the cause.
Why Seat Pressure Sensor Drift Gets Misdiagnosed
A completed seat does not expose a sensor to force alone. Trim tension loads the cushion. Polyurethane foam spreads the load and relaxes with time. An adhesive spacer defines an internal gap. Curvature, tail routing, connectors, wiring resistance, an analog front end, and threshold logic all sit in the measurement path. When the final ADC count moves, any one of those layers—or several at once—may be responsible.
That distinction matters in automotive seating applications. A small analog shift can be harmless when the empty and occupied distributions remain far apart. The same shift can be unacceptable near a threshold with little guard band. Conversely, a large percentage calculated near zero load may look alarming while having no effect on the released state decision. The requirement must therefore connect raw signal, physical state, and system output.
Temperature adds another trap. A hot measurement taken immediately after chamber entry mixes the sensor’s thermal response with incomplete soak. A reading taken after a seated dwell mixes thermal response with viscoelastic creep. A post-cycle reading taken after recalibration cannot reveal the permanent zero or sensitivity shift that recalibration removed. “Before versus after” is not enough.
The regulatory boundary must also stay clear. UNECE publishes system-level safety-belt-reminder requirements in UN Regulation No. 174. That regulation does not qualify a particular flexible mat construction. The component still needs a program-specific environment, seat stack, electronics, algorithm, sampling plan, and acceptance criteria.
Drift, Creep, Hysteresis, and Repeatability Are Different Measurements
Seat pressure sensor drift is a change in output while the defined input is held constant over a defined time. The definition is incomplete unless it names the reference reading, load, dwell, environment, power state, and calculation. A specification such as “drift <5%” cannot be compared with another until those conditions match.
FSR temperature drift is the portion of output change associated with temperature. It may be reversible, partly recoverable, or coupled to humidity and time. Sensitronics’ the resistance-temperature relationship depends on ink composition and sensing area; low-drift applications require characterization or compensation for the actual sensor.
Creep is time-dependent deformation or response under sustained load. In a seat assembly, creep can occur in the pressure-sensitive layer, foam, adhesive, spacer, load spreader, or trim. Stress relaxation describes declining stress under constrained deformation. The two concepts are related but should not be used interchangeably in a report.
Hysteresis is the difference between loading and unloading outputs at the same input. Repeatability measures agreement among repeated readings under the same stated procedure. Permanent shift is the residual change after unloading and a defined recovery period. Pressure mat aging is broader: it covers irreversible changes caused by thermal exposure, humidity, load cycling, chemical contact, storage, or material interaction.
A practical normalized change calculation is:
[ \Delta S_{norm}(t,T)=\frac{S(t,T)-S_{ref}}{S_{span,ref}}\times100% ]
Here, Sref is a stated baseline and Sspan,ref is the reference span between selected load states. Normalizing by span is often more informative than dividing by a near-zero empty-seat signal. Report the raw values too; normalization can hide saturation, nonlinearity, and direction.
| Metric | Hold constant or control | Required timing | Decision it supports |
|---|---|---|---|
| Short-term drift | Load, actuator, geometry, temperature | Seconds to hours after load application | Sampling delay and threshold timing |
| Temperature response | Load, dwell, humidity, electronics state | At stabilized hot/cold points | Compensation and guard band |
| Hysteresis | Load path and rate | Matched loading/unloading sequence | State transition behavior |
| Seat sensor repeatability | Assembly, position, cycle, recovery | Repeated identical cycles | Production and fixture variation |
| Permanent shift | Baseline fixture and recovery | Before exposure and after defined recovery | Aging and recalibration policy |
| Compression set | Foam specimen geometry and method | After specified compression and recovery | Foam contribution to preload |
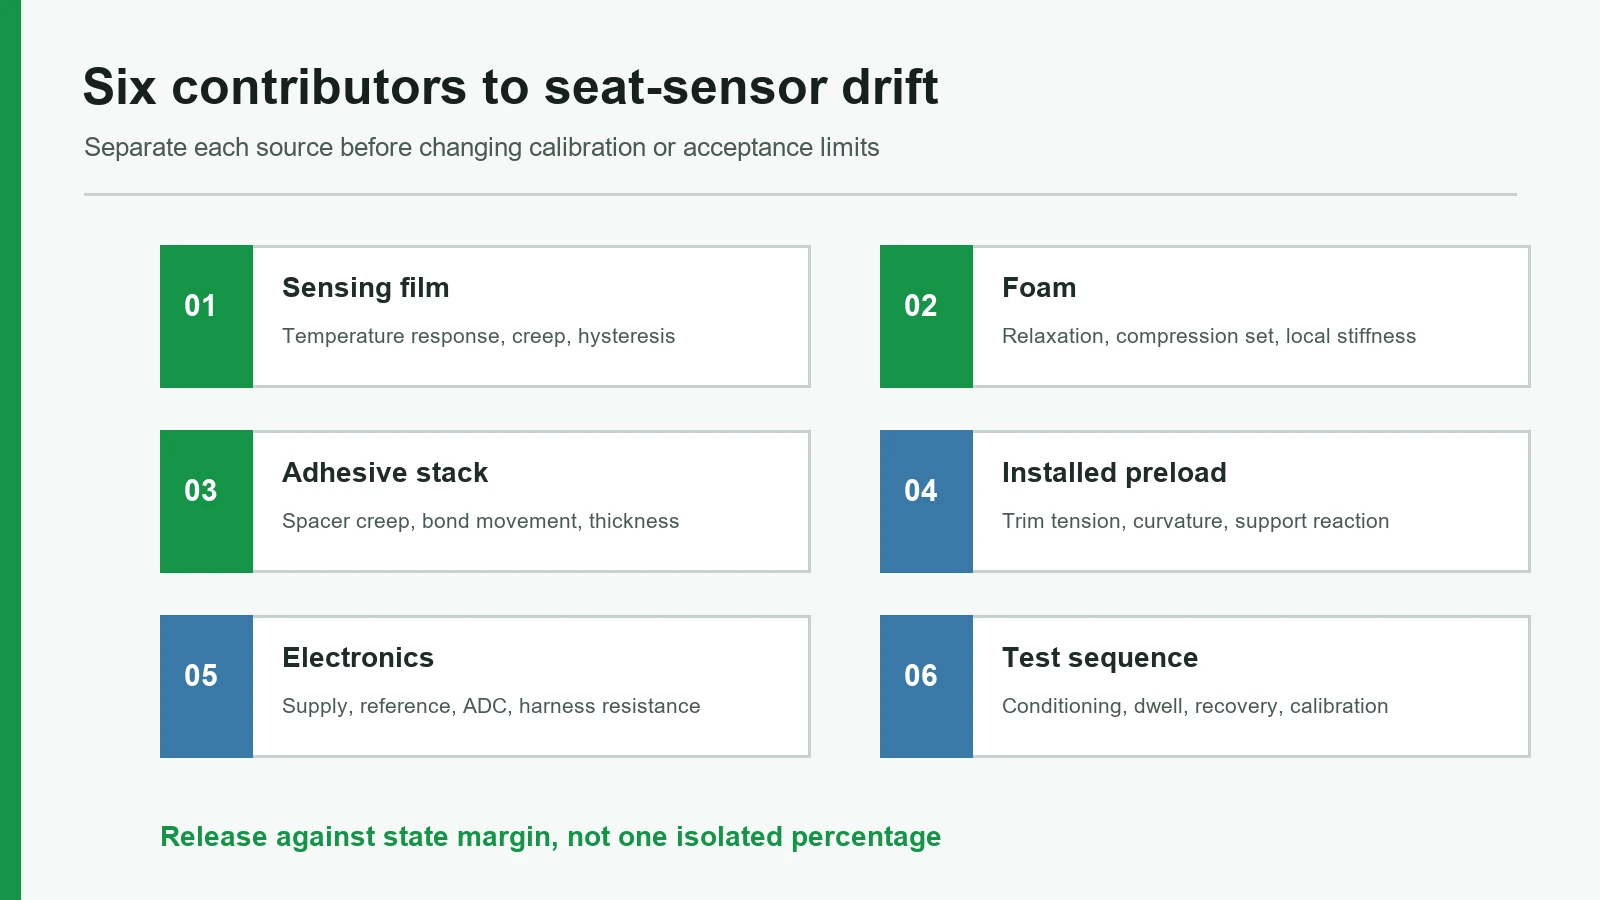
The Six-Layer Drift Stack
An installed seat occupancy sensor mat should be treated as a measurement chain rather than a single part.
Occupant or calibrated fixture
load magnitude, position, dwell, motion
Seat trim and suspension
tension, curvature, thermal expansion
Polyurethane foam / load spreader / actuator
stress relaxation, compression set, contact area
FSR film + electrodes + spacer + adhesive + carrier
resistance response, creep, bond movement, preload
Tail + connector + harness
contact and conductor resistance
Analog front end + reference + ADC + software
offset, gain, sampling, filtering, threshold logic
Reported empty / occupied / classification state
The corresponding failure chain is:
Heat + humidity + sustained or cyclic load
material or electrical parameter changes
contact area, preload, resistance, offset, or gain moves
raw signal and distribution move
threshold guard band shrinks
false state transition becomes possible
This chain prevents a common analytical error: assigning every raw-signal change to the pressure-sensitive ink.
1. Pressure-sensitive film response
Interlink Electronics describes its FSR 400 Series as polymer thick-film devices whose resistance decreases with rising force. Its long-term drift as <5% log10(time) under a 1 kg load for 35 days. The same document reports separate one-hour resistance changes at −40°C, +85°C, and +85°C with 95% relative humidity rather than one universal temperature coefficient.
Those figures establish a reporting lesson, not a seat-mat guarantee. They belong to a named product family, load, duration, and test convention. Tekscan publishes different but equally bounded data for the FlexiForce A201: load drift below 5% per logarithmic time under a constant 111 N load, temperature sensitivity of 0.36%/°C under conductive heating, repeatability below ±2.5%, and hysteresis below 4.5% of full scale. Neither dataset can be copied into an RFQ for a custom seat mat without checking construction and conditions.
2. Foam relaxation and compression set
Seat foam changes the force reaching the sensing zones. During a sustained load, viscoelastic relaxation can reduce local contact stress even if the external fixture remains fixed. After thermal exposure or repeated compression, residual thickness loss can alter baseline preload and load distribution.
ISO 1856:2018 specifies three methods for determining compression set in flexible cellular materials, including polyurethane foam thicker than 2 mm. ASTM D3574-25 covers a broader family of tests for slab, bonded, and molded flexible polyurethane foam. These methods help characterize the foam, but a completed seat still needs a stack-level study because cushion geometry, trim, and load path differ from a coupon.
3. Adhesive and spacer creep
A pressure-sensitive adhesive is structural in the measurement sense even when it is not carrying the full seat load. It fixes electrode registration, seals the active region, and holds the spacer geometry that establishes an air gap or actuation threshold. Heat and sustained shear can permit slow movement. A bond-line thickness change can alter preload or contact progression.
3M’s VHB 4951 technical data sheet discusses creep under sustained static load for that specific tape. It is not evidence for a seat-mat adhesive. It does show why “automotive-grade adhesive” is not a test condition. A review needs the exact adhesive, carrier, coat weight or thickness, substrate preparation, bond dwell, temperature, applied stress, and dimensional inspection points.
4. Assembly preload and contact mechanics
The Interlink FSR 400 Integration Guide calls for consistent actuator area, shape, material, position, force distribution, and cycle timing. Curvature or stress near the active area can create preload and false readings. Tekscan’s mechanical-integration guidance similarly recommends loading the same sensor area each cycle and evaluating puck or interface compliance.
In a seat, the actuator may be a foam feature rather than a machined puck. Its effective area changes as foam modulus changes with temperature. Trim tension, hog-ring location, cushion curvature, and tail routing can add a standing load. If the mat is removed and reinstalled between tests, assembly variation may exceed the sensor effect under investigation.
5. Electronics and harness temperature error
FSR output is read through a circuit, not in isolation. Divider resistors, op-amp input offset, bias current, gain-setting components, voltage references, ADC gain and offset, connector contact resistance, and harness leakage can all vary with temperature. Analog Devices’ CN0336 demonstrates a component-level temperature error budget for a precision signal chain. It is not a seat ECU design, but the method is transferable: allocate and measure each contributor.
Electronics isolation points
| Signal-chain element | Temperature-sensitive quantity | Control |
|---|---|---|
| Excitation or supply | Voltage and source impedance | Log at the connector during every dwell |
| Divider / gain resistors | Resistance and ratio tempco | Use specified matched networks or measured references |
| Operational amplifier | Input offset, bias, and gain error | Include hot/cold zero and simulator points |
| ADC and reference | Offset, gain, reference voltage | Record raw code and reference channel |
| Connector and harness | Contact resistance and leakage | Measure end-to-end or use a chamber-through simulator |
A precision resistor or programmable sensor simulator connected at the mat input can separate electronics drift from the mechanical stack. A four-wire resistance measurement of the passive sensor can provide another boundary. If the chamber test records only processed ADC counts, root-cause isolation becomes difficult.
6. Conditioning, calibration, and algorithm timing
Calibration can reduce systematic error and still ruin a drift investigation if it occurs at the wrong time. Tekscan recommends calibrating a conditioned sensor in the completed assembly, or as close to its final configuration as possible, using the expected force range and load duration. That advice supports product calibration. For root-cause testing, however, the team must preserve an untouched baseline before applying compensation.
A seat algorithm also samples after a defined delay, applies filters, and may use hysteresis between state thresholds. A 20-second human-seating record is not equivalent to an eight-hour static dwell. Ma, Hu, and Guo’s 2026 Vehicles study of automotive seat-pressure signals used 90 twenty-second records from 30 participants and explicitly identified fixed-load or dummy-based testing as future work. Human posture is valuable for system validation, but a calibrated fixture is better for separating material and electronics effects.
Eight Checks Before Accepting a Drift Specification
1. Define each response term and reference state
A usable specification distinguishes drift, temperature response, hysteresis, repeatability, and post-recovery shift. It names the baseline: first reading, stabilized reading, room-temperature pretest value, or unloaded zero. It also states whether the denominator is raw output, full-scale output, calibrated span, or distance to a threshold.
Every metric includes load, temperature, humidity, dwell, sampling interval, conditioning, recovery, and calculation direction.
One “accuracy” percentage is used for all temperatures, loads, and time windows.
2. Keep every sensor number attached to its test conditions
Catalog values are useful for screening constructions. They are not interchangeable. The Interlink FSR 400 and Tekscan A201 examples differ in device geometry, load, thermal method, reporting convention, and likely circuitry. Ink composition and surface area affect thermal behavior.
The evidence table identifies model, sample count, load applicator, force, contact area, temperature method, power state, dwell, and instrument.
A supplier copies a standard-sensor percentage into a custom pressure-mat proposal without a correlation plan.
3. Measure foam separately before blaming the mat
Use foam coupons or a controlled cushion fixture to measure residual thickness, force-deflection change, and recovery under the chosen environment. ISO 1856 or the applicable ASTM D3574 method can provide a common foam vocabulary. Then repeat with the sensor absent, present but unpowered, and fully instrumented.
The test report contains bare-foam, bare-sensor, and completed-stack controls from traceable material lots.
Every trial contains aged foam, so no result can isolate pressure mat aging from cushion aging.
4. Record the adhesive and spacer as controlled materials
An assembly drawing should state adhesive product, thickness or coat weight, spacer outline, vent features, substrate treatment, lamination pressure, and bond dwell. Measure critical dimensions before exposure, hot when feasible, and after recovery. Cross-sections from sacrificial samples can reveal spacer movement or bond-line change.
Material certificates and released drawings map each adhesive/spacer lot to the tested mats.
“Equivalent adhesive permitted” appears without a requalification boundary.
5. Freeze preload, trim tension, and fixture geometry
Define how the seat is assembled and loaded. SAE J826_202106 provides devices and procedures for vehicle seating-accommodation measurements on a deflected seat; it can support repeatable geometry but is not a sensor-drift standard. SAE J2896_201201 addresses seat-comfort performance, which is a different endpoint from occupant detection.
The fixture drawing controls load points, actuator shape, H-point or program datum, trim condition, assembly torque, and reinstallation policy.
An operator places loose weights by hand and reassembles the cushion between readings without a reproducibility study.
6. Give electronics a separate reference channel
Test the passive mat and powered signal chain both together and separately. Log chamber air, sensor-body temperature when practical, supply, reference, raw ADC code, converted engineering value, and final state. Substitute stable resistors at empty, threshold-near, and occupied-equivalent points.
A simulator channel travels through the same harness and electronics during the chamber cycle.
The report contains only filtered “occupied/not occupied” outputs and no raw channel data.
7. Lock the sequence before testing
A defensible sequence includes conditioning, room-temperature baseline, hot and cold dwells, sustained-load segments, unloaded recovery, repeated cycles, and a final room-temperature check. ISO 16750-4:2023 covers climatic loads for vehicle electrical/electronic equipment, but the applicable profile and severity must come from the vehicle program and component location.
The plan freezes ramp, dwell, load timing, sample timing, power state, and recovery before samples enter the chamber.
The team changes dwell or recalibrates after seeing an unfavorable curve, then compares the new result with the untouched baseline.
8. Tie the limit to the state-decision margin
For a binary seat-belt-reminder input, the essential question may be whether empty and occupied distributions remain separated through life and environment. For occupant classification, several load and posture states may matter. In either case, account for lot variation, seat-build variation, measurement uncertainty, and the algorithm’s threshold hysteresis.
Acceptance criteria specify state, threshold guard band, allowed false transitions, sample/lot plan, and treatment of uncertainty.
A percentage passes on average while one safety-relevant state crosses its decision boundary.
How to Specify Seat Pressure Sensor Drift
Start with the decision boundary, then work backward to the component tests. Do not begin by copying a catalog percentage.
A staged diagnostic test matrix
| Stage | Test article | Controlled input | Measurements | What the stage isolates |
|---|---|---|---|---|
| 1 | Electronics + precision resistors/simulator | Resistance states at selected temperatures | Supply, reference, raw ADC, processed output | Harness and electronic offset/gain drift |
| 2 | Bare sensing element | Rigid, repeatable actuator; defined force and dwell | Resistance or conductance versus time and temperature | FSR temperature drift and intrinsic creep |
| 3 | Laminated mat without seat foam | Same actuator; controlled substrate and curvature | Zone outputs, zero, span, hysteresis, dimensions | Adhesive, spacer, lamination, and carrier effects |
| 4 | Foam/load spreader without active mat | Deflection or load under defined environment | Force relaxation, thickness, recovery | Foam relaxation and compression set |
| 5 | Passive completed seat stack | Fixed seat fixture and load states | Mat resistance plus stack force/deflection | Preload, trim, curvature, and load-path effects |
| 6 | Powered completed seat | Program harness, ECU, software, sampling | Raw channels, converted values, state transitions | End-to-end system margin |
| 7 | Post-exposure teardown | Released inspection plan | Dimensions, bond condition, conductor/connector checks | Permanent physical change and failure evidence |
The stages need not use the same sample count, but each needs traceable specimens and at least one bridge measurement to the next stage. For example, test selected bare sensors before lamination, then follow those serial numbers through mat and seat assembly.
Recommended sequence
| Step | Action | Required record |
|---|---|---|
| 1 | Freeze definitions and calculations. | Define Sref, normalization, sign, stabilization, dwell start, and recovery endpoint. |
| 2 | Condition samples consistently. | Record preload or cycles; retain unconditioned controls when initial settling matters. |
| 3 | Capture an untouched room-temperature baseline. | Save raw resistance/conductance and powered outputs before compensation changes. |
| 4 | Run electronics controls with every environment. | Stable-resistor channels identify electronic contributions. |
| 5 | Apply hot/cold and sustained-load segments in a fixed order. | Randomize or counterbalance order when sequence effects could bias the result. |
| 6 | Unload and recover for a defined period. | Report immediate recovery and the selected final recovery point. |
| 7 | Return to the initial condition before recalibration. | Preserve permanent zero/span shift before applying new coefficients. |
| 8 | Repeat at completed-seat level. | Run human trials after fixture work, not instead of it. |
Initial stability screen
Use +/-5% change after the defined dwell at each selected temperature as an early comparison screen. Published model-specific FSR drift and repeatability data place this value in a practical feasibility range, but the production limit must preserve the program's state-decision margin across sensor materials, foam, trim, adhesive, electronics, fixture, load states, environment, recovery, samples, and lots. For a binary release, zero false transitions plus a measured guard band is often the more useful criterion.
Project Inputs and Sample-Approval Checklist
A supplier cannot define a credible stability plan from “works from cold to hot.” The RFQ or design-input package should contain the following.
Planning inputs by owner
| Owner | Inputs to release | Evidence at sample approval |
|---|---|---|
| Seat engineering | Cushion/trim drawings, datums, foam specification, assembly sequence | Built-seat configuration record and fixture correlation |
| Sensor engineering | Zone geometry, materials, tail, connector, preload boundary | Lot traceability, dimensional results, bare-sensor baseline |
| Electronics | Excitation, ADC/reference, filters, diagnostics | Simulator-channel temperature results and raw logs |
| Validation | Environment, loads, dwell, cycles, recovery, sample plan | Approved protocol, calibrated references, deviations, raw data |
| Systems/software | States, thresholds, hysteresis, fault handling | Decision-margin analysis and false-transition results |
| Quality/sourcing | Change control, evidence format, supplier responsibilities | Signed report, approvals, and controlled-document links |
Environment and duty cycle
- Minimum, maximum, nominal, and transition temperatures at the sensor location
- Humidity or condensation condition; powered and unpowered states
- Ramp, dwell, cycles, storage exposures, and recovery conditions
- Sustained-load duration, load/unload frequency, and sampling delay
- Chemicals, cleaners, sweat simulants, and material-contact restrictions when applicable
Mechanical stack
- Seat cushion and trim drawings, datums, tolerance stack, and assembly sequence
- Foam grade, density, force-deflection specification, aging condition, and lot traceability
- Sensor location, active-zone geometry, tail bend/routing, connector, carrier, and retention
- Expected load states, load distribution, actuator/contact geometry, and allowable preload
- Reassembly policy and fixture correlation to the production seat
Electronics and algorithm
- Excitation/readout topology, resistor tolerances, ADC/reference details, sample rate, and filtering
- Raw-data access, diagnostic channels, fault handling, and calibration storage
- Empty, occupied, edge-case, ingress/egress, and misuse states
- Thresholds, hysteresis, guard bands, and required false-transition performance
Evidence and release
- Sample size, number of material lots, seat builds, and test sequence
- Reference-instrument calibration and uncertainty
- Predefined missing-data, outlier, and failure-handling rules
- Bare-sensor, foam-only, electronics-only, and completed-seat controls
- Signed report, raw-data location, deviations, teardown evidence, and change-control triggers
When third-party testing is required, ISO/IEC 17025:2017 provides the competence framework for testing and calibration laboratories. Accreditation alone does not prove that a specific seat-pressure method sits within the laboratory’s accredited scope; request the scope and method reference.
When an FSR Seat Mat Is Not the Best Choice
A flexible FSR mat is useful where thin construction, shape freedom, low-profile integration, and threshold-oriented force detection matter. It is not automatically the best choice for every measurement task.
Choose another architecture, or run a formal technology comparison, when the program needs traceable force metrology over long static dwells, very low drift without frequent reference correction, highly linear multi-axis force, or classification margins too narrow for the installed stack’s viscoelastic behavior. Load cells, strain-gauge structures, capacitive arrays, pneumatic bladders, or other technologies may offer better fit depending on packaging, cost, redundancy, diagnostics, and safety goals.
A pressure-mapping system used for comfort development is also not interchangeable with a production occupancy mat. The sensor density, calibration model, electronics, installation, and decision endpoint differ. The broader car seat occupancy sensor architecture should be selected from the system requirement, not from one attractive datasheet number.
Evidence Release Blockers That Should Stop Approval
- No defined reference reading — drift cannot be reproduced without a start point.
- No load applicator drawing — contact area and placement may dominate the result.
- Sensor and electronics never separated — root cause remains unknown.
- Foam lot and aging state are missing — pressure mat aging may actually be cushion change.
- Calibration occurs between baseline and final comparison — permanent shift is masked.
- Only average data are reported — lot tails and state-boundary crossings disappear.
- A standard is named without an applicable clause or profile — scope is being mistaken for compliance.
- Certification or customer evidence lacks traceable authorization — sourcing evidence is not auditable.
Frequently Asked Questions
What causes seat pressure sensor drift?
Seat pressure sensor drift can originate in the pressure-sensitive film, foam relaxation, adhesive or spacer creep, assembly preload, harness and electronics temperature error, or calibration timing. A completed-seat reading alone cannot identify the cause; controlled subassembly tests are needed.
How is FSR temperature drift different from long-term drift?
FSR temperature drift is output change associated with temperature under stated conditions. Long-term drift is change with elapsed time under a held input. They can overlap during a hot sustained-load test, so the plan needs temperature-only, load-only, and combined controls.
Can a supplier quote one universal drift percentage for a seat mat?
No credible universal percentage covers every construction. Interlink FSR 400 and Tekscan A201 data use different models, loads, methods, and reporting conventions. A custom mat needs values tied to its materials, geometry, electronics, seat stack, dwell, and environment.
How should seat sensor repeatability be measured?
Seat sensor repeatability should use the same fixture, actuator, load location, load rate, dwell, temperature, recovery, electronics, and assembly condition for each cycle. Report individual results and distribution, not only an average. Include reinstallation as a separate reproducibility study if production assembly variation matters.
How can a test separate pressure mat aging from foam aging?
Run parallel controls: bare sensor, foam or cushion without an active mat, laminated mat without foam, passive completed stack, and powered completed seat. Measure foam thickness or force-deflection recovery separately using an applicable method such as ISO 1856 for compression set.
Should calibration happen before or after temperature cycling?
Capture and preserve a pre-cycle calibration and raw baseline first. After cycling and defined recovery, measure the unchanged system before applying new coefficients. Recalibration can then show recoverable performance, but it must not replace the permanent-shift result.
Does ISO 16750-4 define the correct seat-sensor temperature cycle?
ISO 16750-4:2023 defines climatic-load test frameworks for vehicle electrical and electronic equipment, but it does not supply one universal profile for every seat location and function. The vehicle program must select applicable stresses, severities, operating modes, dwell, and acceptance criteria.
Is ±5% an acceptable drift limit for an automotive seat sensor?
Use +/-5% only as an early feasibility screen. The released limit must preserve the empty/occupied or classification margin across samples, lots, seats, environment, aging, and measurement uncertainty.
Define the Cycle and Stability Requirement Next
Before requesting samples, issue a one-page stability input that defines the temperature and humidity points, ramp and dwell, sustained and cyclic loads, fixture and seat stack, powered state, sampling times, recovery, calculation, sample/lot plan, and decision margin. Then ask the supplier to map each result to sensor film, foam, adhesive, preload, electronics, or calibration—not merely to report one final percentage.
JASPER can be considered as one manufacturing option for a program that needs a custom flexible sensing geometry and an agreed validation plan. The next useful step is to align the project input with JASPER’s testing and validation capabilities and contact JASPER engineering with the proposed temperature cycle and stability requirement. Interlink Electronics, Tekscan, and Sensitronics also publish useful FSR characterization and integration guidance; their published values remain specific to their own products and conditions.
Technical References
- Source: ISO 16750-4 Climatic Loads for Vehicle Electrical Equipment. Accessed 2026.
- Source: IEC 60068-2-14 Change of Temperature Testing. Accessed 2026.
- Source: ISO 1856:2018 Flexible Cellular Material Compression Set. Accessed 2026.
- Source: ASTM D3574-25 Flexible Cellular Material Test Methods. Accessed 2026.
- Source: ASTM D903-98(2024) Peel or Stripping Strength of Adhesive Bonds. Accessed 2026.
- Source: UN Regulation No. 174. Accessed 2026.
- Source: FSR 101. Accessed 2026.
- Source: FSR 400 datasheet. Accessed 2026.
- Source: ISO 1856:2018. Accessed 2026.
- Source: ASTM D3574-25. Accessed 2026.
- Source: VHB 4951 technical data sheet. Accessed 2026.
- Source: Interlink FSR 400 Integration Guide. Accessed 2026.
- Source: CN0336. Accessed 2026.
- Source: study of automotive seat-pressure signals. Accessed 2026.
- Source: J826_202106. Accessed 2026.
- Source: J2896_201201. Accessed 2026.
- Source: 16750-4:2023. Accessed 2026.
- Source: ISO/IEC 17025:2017. Accessed 2026.
Review the complete seat sensing stack before release
Send the cushion section, sensor zone, seat frame, harness route, output logic, environment, and validation boundary for review.